
10: Introduction to Spectroscopy
- Page ID
- 189392
INTRODUCTION
Spectroscopy is the study of the interaction between matter and electromagnetic radiation. The types of electromagnetic radiation are often divided into the following broad categories (from short to long wavelengths): gamma radiation, X-ray radiation, ultraviolet radiation, visible radiation, infrared radiation, microwave radiation, and radio waves. Figure 1 illustrates the full electromagnetic spectrum.
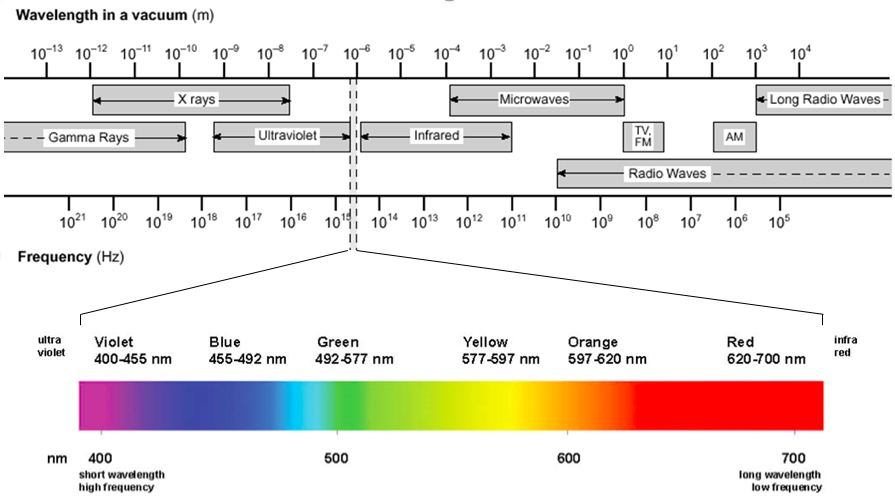
Figure 1: The electromagnetic spectrum, with the visible spectrum highlighted
The visible spectrum of light is only one small sliver of the electromagnetic spectrum. It falls between approximately 400 nm to 700 nm, but our eyes distinguish the different wavelengths of light as different colors. The regions directly above and below this wavelength range are known as the infrared (IR) and ultraviolet (UV), respectively. The pigments in our eyes selectively absorb photons of the visible spectrum, but not those outside of it, because of their chemical makeup.
White light is a mixture of all visible wavelengths, which can be demonstrated by passing it through a prism or diffraction grating, which disperses the light into all of its component colors. When white light hits an object, some of the light may be reflected, some of it may be absorbed, and some of it may be transmitted (it passes through the object). Color arises from the selective absorption of photons of specific wavelengths. If the object is opaque, such as a wall, the reflected color is the complement of the color absorbed. If the object is transparent, such as a liquid, the transmitted color is the complement of the color absorbed. A spectrometer can separate the component colors coming either directly from an emission source or from the light transmitted through a sample. A top-down diagram of a spectrometer is shown in Figure 2.
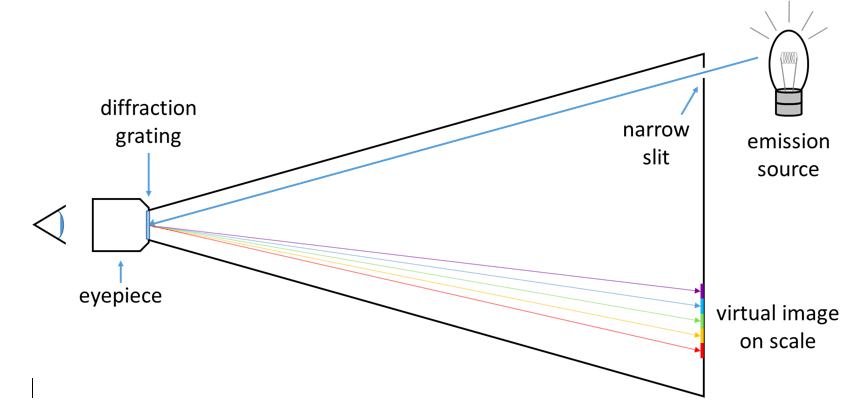
Figure 2: The light path through a simple spectrometer
When the light from a simple emission source (like a single element) is viewed through a spectrometer, only specific lines of color are seen. Each of these lines corresponds to a unique electronic transition and the collection of lines is characteristic of the emission source. The emission spectrum for hydrogen is shown in Figure 3.
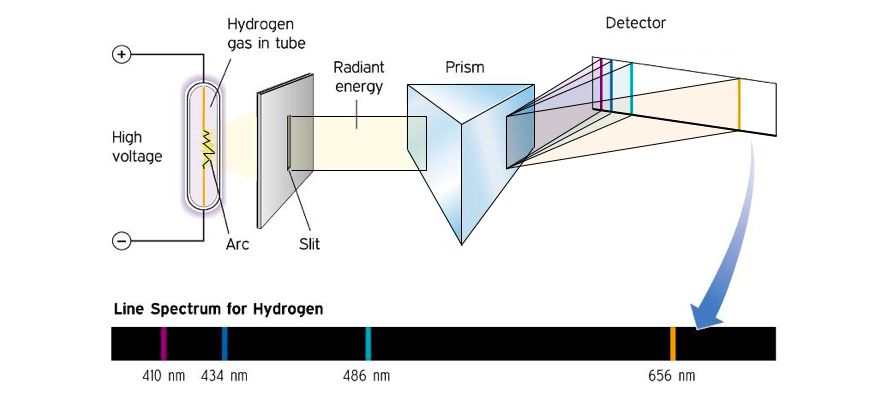
Figure 3: Production of the emission spectrum for hydrogen
A spectrophotometer is used to measure how much light is absorbed by a sample at varying wavelengths. In this instrument, a beam of monochromatic light is directed through a solution and the intensity of light transmitted (It) is compared to the intensity of the incident beam (Io), as shown in Figure 4. This fraction, sometimes expressed as a percentage, is termed the transmittance (T) of the sample at a particular wavelength:
\[\mathrm{T}=\frac{\mathrm{I}_{t}}{\mathrm{I}_{o}}\]
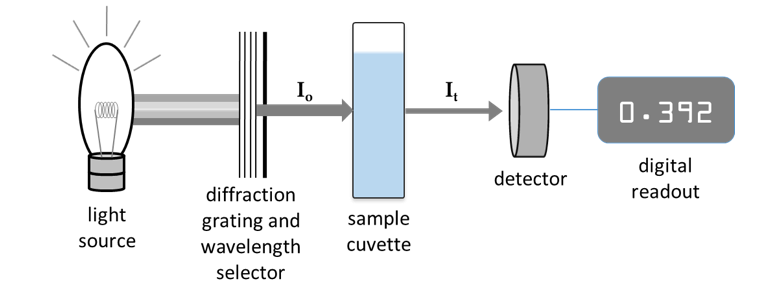
Figure 4: Simplified schematic of a spectrophotometer
Although it is sometimes useful to plot transmittance as a function of wavelength to get a transmittance spectrum, we will be focusing on absorbance (A), which is defined as:
\[\mathrm{A}=-\log \mathrm{T}=-\log \left(\frac{I_{t}}{I_{o}}\right)\]
You can see from this equation that, as the transmittance diminishes, the absorption increases. Also, note that absorbance has no units.
In this experiment, you will use a spectrometer and a spectrophotometer to begin examining the different modes of light absorption and emission.
OBJECTIVES
1. To learn how light absorption and emission are observed.
2. To learn to operate and make measurements using a simple spectrometer and a spectrophotometer.
PROCEDURE
Part 1: Using a simple spectrometer
For each observation, make a sketch of the spectrum that fills the width of the page. Start with a horizontal bar and label the bottom of the bar with the wavelength scale (from 400-700 nm) and draw what you observe above the bar.
A) Continuous spectrum
1) Set up a spectrometer so that the slit is in front of the light from an incandescent lamp (as a source of white light).
2) Look into the spectrometer and observe the dispersed spectrum of white light on the screen of the spectrometer.
3) Record your observations in your lab notebook. You should record the range of wavelengths of each of the colors you observe.
B) Absorption in a colored solution
1) Place one of the provided colored solutions between the incandescent light source and the slit of the spectrometer. Your colored solution should completely cover the slit of the spectrometer.
2) Look into the spectrometer and observe the resulting spectrum. The spectrum will contain dark bands in the spectral regions in which the solute absorbs light. These colors are missing in the transmitted light that now enters the spectrometer.
3) Note what colors are missing (i.e. those absorbed by the solution). Record your observations, emphasizing the wavelength ranges where the dark bands occur. Repeat this process for each of the colored solutions.
C) Gas Discharge Tubes
1) Using a spectrometer, observe the emission spectra of a hot gas. At least one gas will be set up in a gas discharge tube for you to observe.
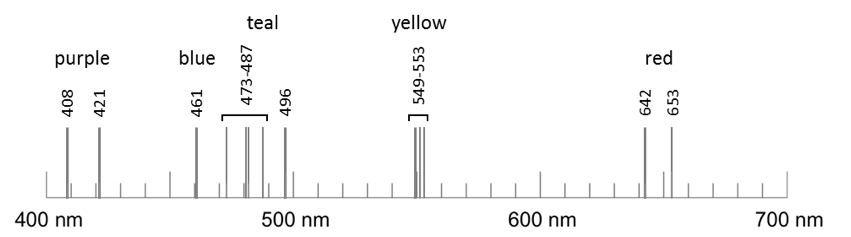
2) In your laboratory notebook, record the colors and wavelengths of the light emitted (the spectral lines) observed for each gas. If a spectrum shows a very large number of lines, you may focus on the locations of the most intense lines, but also describe the general bands or clusters of lines that you see. Do not include any dim bands of color – these are likely to be artifacts that are not coming directly from the sample. An example for strontium is shown below.
D) Comparing Incandescent Light with Fluorescent Light
1) Using a spectrometer, observe the emission spectrum from a fluorescent lamp. Record how this spectrum compares to that of the incandescent lamp, including the lowest and highest wavelengths observed. You should also observe several bright spectral lines visible against the broader background. Record the color and wavelength of these bright spectral lines.
Part 2: Using a spectrophotometer (Spectronic 20)
General note about handling cuvettes: Since we want to measure how much light is absorbed by the contents of a cuvette, any contaminants on the outside (including things like fingerprints) with impact your measurements. Please wipe down the sides of your cuvettes before inserting them into the instrument.
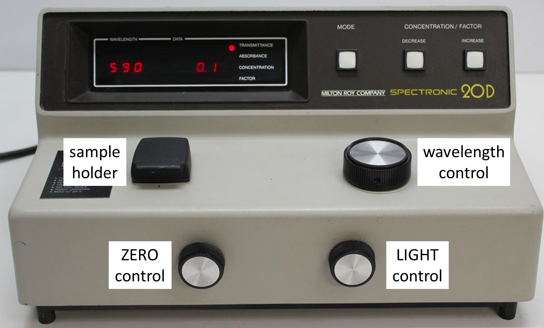
Figure 5: Controls on a Spectronic 20
A) Light beam inside a spectrophotometer
1) Turn on the Spectronic 20 by rotating the ZERO control knob clockwise one full turn, and allow the instrument to warm up for at least 5 minutes. Set the wavelength to 550 nm.
2) Obtain a cuvette with a piece of chalk inside. Place the cuvette in the sample compartment of the Spectronic 20. Leave the sample compartment cover open.
3) Look straight down into the sample compartment and cup your hand around the compartment opening. You should see a green color on one side of the chalk.
4) While looking straight down into the sample compartment, slowly turn the wavelength control knob from 400 nm to 700 nm. You should be able to observe the color reflected by the chalk. Record each color that you see and the wavelength range for each color. Record the shortest and the longest wavelength at which you can see the colors.
B) Calibration of the Spectronic 20
Before using a spectrophotometer to measure absorbance data, the instrument must first be calibrated! For each color of light (each wavelength) where we wish to measure absorbance, we must first set the 0% transmittance and 100% transmittance values (this is just like how you must tare a balance before you use it to measure a sample mass).
1) Turn on the Spec 20 by rotating the ZERO control (front left knob) clockwise one full turn, and allow the instrument to warm up for at least 5 minutes. Press the MODE button to select TRANSMITTANCE.
2) Turn the WAVELENGTH control knob to the desired wavelength.
3) With the sample holder empty and the cover closed, adjust the ZERO control knob so that the meter reads 0% transmittance.
4) Insert the blank (a cuvette containing water) into the sample holder. Close the cover and turn the LIGHT control (front right knob) until the meter reads 100% transmittance.
5) Remove the blank cuvette. Now you are ready to start measuring.
C) Measuring absorbance using the Spectronic 20
1) Insert a cuvette containing a sample solution into the sample compartment.
2) Change the mode to ABSORBANCE and record the value displayed.
3) Remove the sample and confirm a 100% transmittance reading with the blank cuvette.
Note: If the absorbances of multiple samples are to be read at the same wavelength, simply insert the next sample and read the absorbance, repeating as necessary. If a new wavelength is to be used, repeat the calibration procedure before making the absorbance measurements at the new wavelength.
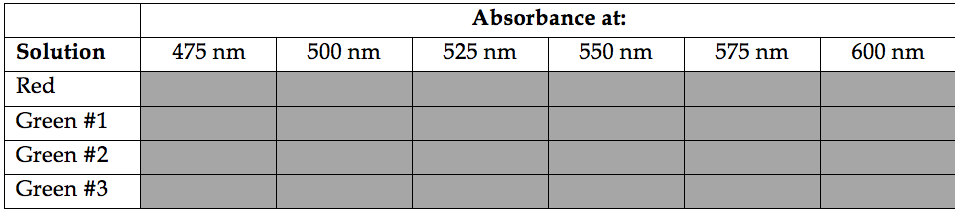
4) Record measurements (in your notebook!) for the red and green solutions provided at the wavelengths indicated in the table below.
Answer the following questions regarding your absorbance measurements.
1) The wavelength at which light is most strongly absorbed by a solution is called \(\lambda_{\max }\) (“lambda max”). What is \(\lambda_{\max }\) for the red solution? What is \(\lambda_{\max })\for the green solutions?
2) Compare the absorbance for each of the green solutions at \(\lambda_{\max }\). Is there a trend? Consider the apparent concentrations of the solutions.