
12.E: Chromatographic and Electrophoretic Methods (Exercises)
- Page ID
- 198758
\( \newcommand{\vecs}[1]{\overset { \scriptstyle \rightharpoonup} {\mathbf{#1}} } \)
\( \newcommand{\vecd}[1]{\overset{-\!-\!\rightharpoonup}{\vphantom{a}\smash {#1}}} \)
\( \newcommand{\id}{\mathrm{id}}\) \( \newcommand{\Span}{\mathrm{span}}\)
( \newcommand{\kernel}{\mathrm{null}\,}\) \( \newcommand{\range}{\mathrm{range}\,}\)
\( \newcommand{\RealPart}{\mathrm{Re}}\) \( \newcommand{\ImaginaryPart}{\mathrm{Im}}\)
\( \newcommand{\Argument}{\mathrm{Arg}}\) \( \newcommand{\norm}[1]{\| #1 \|}\)
\( \newcommand{\inner}[2]{\langle #1, #2 \rangle}\)
\( \newcommand{\Span}{\mathrm{span}}\)
\( \newcommand{\id}{\mathrm{id}}\)
\( \newcommand{\Span}{\mathrm{span}}\)
\( \newcommand{\kernel}{\mathrm{null}\,}\)
\( \newcommand{\range}{\mathrm{range}\,}\)
\( \newcommand{\RealPart}{\mathrm{Re}}\)
\( \newcommand{\ImaginaryPart}{\mathrm{Im}}\)
\( \newcommand{\Argument}{\mathrm{Arg}}\)
\( \newcommand{\norm}[1]{\| #1 \|}\)
\( \newcommand{\inner}[2]{\langle #1, #2 \rangle}\)
\( \newcommand{\Span}{\mathrm{span}}\) \( \newcommand{\AA}{\unicode[.8,0]{x212B}}\)
\( \newcommand{\vectorA}[1]{\vec{#1}} % arrow\)
\( \newcommand{\vectorAt}[1]{\vec{\text{#1}}} % arrow\)
\( \newcommand{\vectorB}[1]{\overset { \scriptstyle \rightharpoonup} {\mathbf{#1}} } \)
\( \newcommand{\vectorC}[1]{\textbf{#1}} \)
\( \newcommand{\vectorD}[1]{\overrightarrow{#1}} \)
\( \newcommand{\vectorDt}[1]{\overrightarrow{\text{#1}}} \)
\( \newcommand{\vectE}[1]{\overset{-\!-\!\rightharpoonup}{\vphantom{a}\smash{\mathbf {#1}}}} \)
\( \newcommand{\vecs}[1]{\overset { \scriptstyle \rightharpoonup} {\mathbf{#1}} } \)
\( \newcommand{\vecd}[1]{\overset{-\!-\!\rightharpoonup}{\vphantom{a}\smash {#1}}} \)
\(\newcommand{\avec}{\mathbf a}\) \(\newcommand{\bvec}{\mathbf b}\) \(\newcommand{\cvec}{\mathbf c}\) \(\newcommand{\dvec}{\mathbf d}\) \(\newcommand{\dtil}{\widetilde{\mathbf d}}\) \(\newcommand{\evec}{\mathbf e}\) \(\newcommand{\fvec}{\mathbf f}\) \(\newcommand{\nvec}{\mathbf n}\) \(\newcommand{\pvec}{\mathbf p}\) \(\newcommand{\qvec}{\mathbf q}\) \(\newcommand{\svec}{\mathbf s}\) \(\newcommand{\tvec}{\mathbf t}\) \(\newcommand{\uvec}{\mathbf u}\) \(\newcommand{\vvec}{\mathbf v}\) \(\newcommand{\wvec}{\mathbf w}\) \(\newcommand{\xvec}{\mathbf x}\) \(\newcommand{\yvec}{\mathbf y}\) \(\newcommand{\zvec}{\mathbf z}\) \(\newcommand{\rvec}{\mathbf r}\) \(\newcommand{\mvec}{\mathbf m}\) \(\newcommand{\zerovec}{\mathbf 0}\) \(\newcommand{\onevec}{\mathbf 1}\) \(\newcommand{\real}{\mathbb R}\) \(\newcommand{\twovec}[2]{\left[\begin{array}{r}#1 \\ #2 \end{array}\right]}\) \(\newcommand{\ctwovec}[2]{\left[\begin{array}{c}#1 \\ #2 \end{array}\right]}\) \(\newcommand{\threevec}[3]{\left[\begin{array}{r}#1 \\ #2 \\ #3 \end{array}\right]}\) \(\newcommand{\cthreevec}[3]{\left[\begin{array}{c}#1 \\ #2 \\ #3 \end{array}\right]}\) \(\newcommand{\fourvec}[4]{\left[\begin{array}{r}#1 \\ #2 \\ #3 \\ #4 \end{array}\right]}\) \(\newcommand{\cfourvec}[4]{\left[\begin{array}{c}#1 \\ #2 \\ #3 \\ #4 \end{array}\right]}\) \(\newcommand{\fivevec}[5]{\left[\begin{array}{r}#1 \\ #2 \\ #3 \\ #4 \\ #5 \\ \end{array}\right]}\) \(\newcommand{\cfivevec}[5]{\left[\begin{array}{c}#1 \\ #2 \\ #3 \\ #4 \\ #5 \\ \end{array}\right]}\) \(\newcommand{\mattwo}[4]{\left[\begin{array}{rr}#1 \amp #2 \\ #3 \amp #4 \\ \end{array}\right]}\) \(\newcommand{\laspan}[1]{\text{Span}\{#1\}}\) \(\newcommand{\bcal}{\cal B}\) \(\newcommand{\ccal}{\cal C}\) \(\newcommand{\scal}{\cal S}\) \(\newcommand{\wcal}{\cal W}\) \(\newcommand{\ecal}{\cal E}\) \(\newcommand{\coords}[2]{\left\{#1\right\}_{#2}}\) \(\newcommand{\gray}[1]{\color{gray}{#1}}\) \(\newcommand{\lgray}[1]{\color{lightgray}{#1}}\) \(\newcommand{\rank}{\operatorname{rank}}\) \(\newcommand{\row}{\text{Row}}\) \(\newcommand{\col}{\text{Col}}\) \(\renewcommand{\row}{\text{Row}}\) \(\newcommand{\nul}{\text{Nul}}\) \(\newcommand{\var}{\text{Var}}\) \(\newcommand{\corr}{\text{corr}}\) \(\newcommand{\len}[1]{\left|#1\right|}\) \(\newcommand{\bbar}{\overline{\bvec}}\) \(\newcommand{\bhat}{\widehat{\bvec}}\) \(\newcommand{\bperp}{\bvec^\perp}\) \(\newcommand{\xhat}{\widehat{\xvec}}\) \(\newcommand{\vhat}{\widehat{\vvec}}\) \(\newcommand{\uhat}{\widehat{\uvec}}\) \(\newcommand{\what}{\widehat{\wvec}}\) \(\newcommand{\Sighat}{\widehat{\Sigma}}\) \(\newcommand{\lt}{<}\) \(\newcommand{\gt}{>}\) \(\newcommand{\amp}{&}\) \(\definecolor{fillinmathshade}{gray}{0.9}\)1. The following data were obtained for four compounds separated on a 20-m capillary column.
|
compound |
tr (min) |
w (min) |
|
A |
8.04 |
0.15 |
|
B |
8.26 |
0.15 |
|
C |
8.43 |
0.16 |
- Calculate the number of theoretical plates for each compound and the average number of theoretical plates for the column.
- Calculate the average height of a theoretical plate.
- Explain why it is possible for each compound to have a different number of theoretical plates.
2. Using the data from Problem 1, calculate the resolution and the selectivity factors for each pair of adjacent compounds. For resolution, use both equation 12.1 and equation 12.19, and compare your results. Discuss how you might improve the resolution between compounds B and C. The retention time for an nonretained solute is 1.19 min.
3. Using the chromatogram in Figure 12.67, obtained using a 2-m column, determine values for tr, w, tr´, k, N, and H.

Figure 12.67 Chromatogram for Problem 12.3.
4. Using the partial chromatogram in Figure 12.68, determine the resolution between the two solute bands.
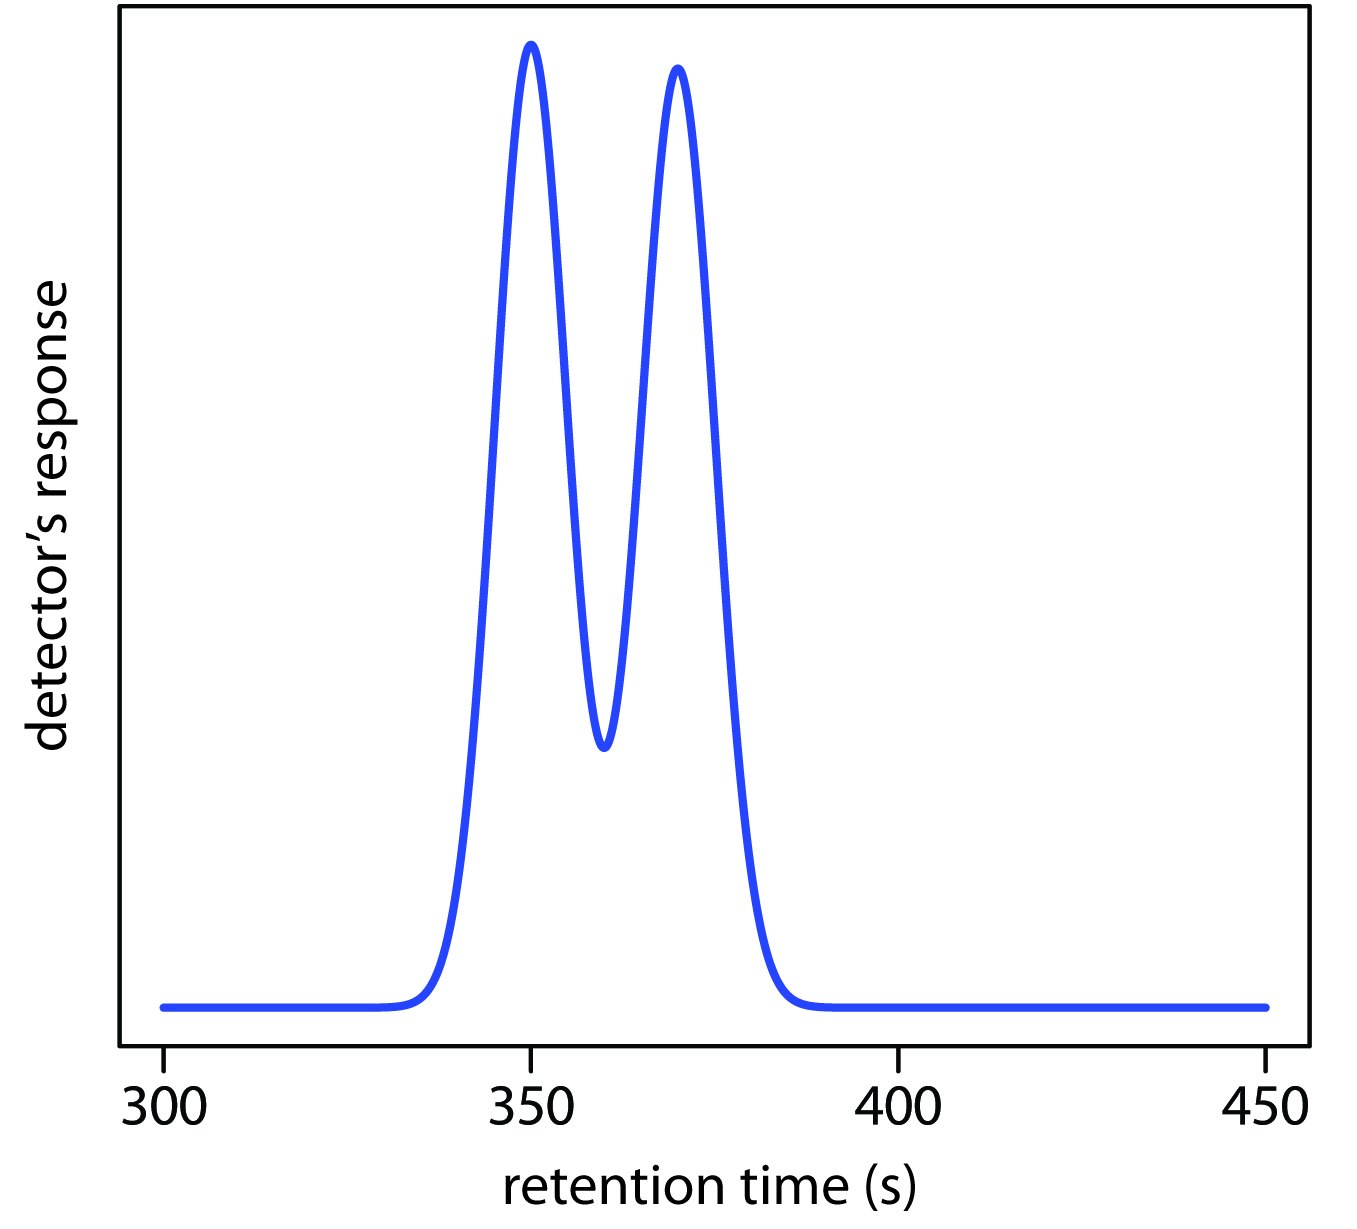
Figure 12.68 Chromatogram for Problem 12.4.
5. The chromatogram in Problem 4 was obtained on a 2-m column with a column dead time of 50 s. Suppose you want to increase the resolution between the two components to 1.5. Without changing the height of a theoretical plate, what length column do you need? What height of a theoretical plate do you need to achieve a resolution of 1.5 without increasing the column’s length?
6. Complete the following table.
|
NB |
α |
kB |
R |
|
100000 |
1.05 |
0.50 |
|
|
10000 |
1.10 |
|
1.50 |
|
10000 |
|
4.0 |
1.00 |
|
|
1.05 |
3.0 |
1.75 |
7. Moody studied the efficiency of a GC separation of 2-butanone on a dinonyl phthalate column.16 Evaluating plate height as a function of flow rate gave a van Deemter equation for which A is 1.65 mm, B is 25.8 mm•mL min–1, and C is 0.0236 mm•min mL–1.
- Prepare a graph of H versus u for flow rates in the range of 5–120 mL/min.
- For what range of flow rates does each term in the Van Deemter equation have the greatest effect?
- What is the optimum flow rate and the corresponding height of a theoretical plate?
- For open-tubular columns the A term is no longer needed. If the B and C terms remain unchanged, what is the optimum flow rate and the corresponding height of a theoretical plate?
- Compared to the packed column, how many more theoretical plates are there in the open-tubular column?
8. Hsieh and Jorgenson prepared 12–33-μm inner diameter HPLC columns packed with 5.44-μm spherical stationary phase particles. To evaluate these columns they measured reduced plate height, h, as a function of reduced flow rate, v,
\[h = \dfrac{H}{d_\ce{p}} \hspace{20px} v = \dfrac{ud_\ce{p}}{D_\ce{m}}\]
where dp is the particle diameter and Dm is the solute’s diffusion coefficient in the mobile phase.
Note
When comparing columns, chromatographers often use dimensionless, reduced parameters. By including particle size and the solute’s diffusion coefficient, the reduced plate height and reduced flow rate correct for differences between the packing material, the solute, and the mobile phase.
The data were analyzed using van Deemter plots. The following table contains a portion of their results for norepinephrine.
|
internal diameter (μm) |
A |
B |
C |
|
33 |
0.63 |
1.32 |
0.10 |
|
33 |
0.67 |
1.30 |
0.08 |
|
23 |
0.40 |
1.34 |
0.09 |
|
23 |
0.58 |
1.11 |
0.09 |
|
17 |
0.31 |
1.47 |
0.11 |
|
17 |
0.40 |
1.41 |
0.11 |
|
12 |
0.22 |
1.53 |
0.11 |
|
12 |
0.19 |
1.27 |
0.12 |
- Construct separate van Deemter plots using the data in the first row and the last row for flow rates in the range 0.7–15. Determine the optimum flow rate and plate height for each case given dp = 5.44 μm and Dm = 6.23 × 10⁻⁶ cm2 s–1.
- The A term in the van Deemter equation appears to be strongly correlated with the column’s inner diameter, with smaller diameter columns providing smaller values of A. Offer an explanation for this observation. Hint: consider how many particles can fit across a capillary of each diameter.
9. A mixture of n-heptane, tetrahydrofuran, 2-butanone, and n-propanol elutes in this order when using a polar stationary phase such as Carbowax. The elution order is exactly the opposite when using a nonpolar stationary phase such as polydimethyl siloxane. Explain the order of elution in each case.
10. The analysis of trihalomethanes in drinking water is described in Representative Method 12.1. A single standard containing all four trihalomethanes gives the following results.
|
compound |
concentration (ppb) |
peak area |
|
CHCl3 |
1.30 |
1.35×10⁴ |
|
CHCl2Br |
0.90 |
6.12×10⁴ |
|
CHClBr2 |
4.00 |
1.71×10⁴ |
|
CHBr3 |
1.20 |
1.52×10⁴ |
Analysis of water from a drinking fountain gives areas of 1.56 × 10⁴, 5.13 × 10⁴, 1.49 × 10⁴, and 1.76 × 10⁴ for CHCl3 CHCl2Br, CHClBr2, and CHBr3, respectively. All peak areas have been corrected for variations in injection volumes using an internal standard of 1,2-dibromopentane. Determine the concentration of each of the trihalomethanes in the sample of water.
11. Zhou and colleagues determined the %w/w H2O in methanol by capillary column GC using a nonpolar stationary phase and a thermal conductivity detector.17 A series of calibration standards gave the following results.
|
%w/w H2O |
peak height (arb. units) |
|
0.00 |
1.15 |
|
0.0145 |
2.74 |
|
0.0472 |
6.33 |
|
0.0951 |
11.58 |
|
0.1757 |
20.43 |
|
0.2901 |
32.97 |
- What is the %w/w H2O in a sample giving a peak height of 8.63?
- The %w/w H2O in a freeze-dried antibiotic is determined in the following manner. A 0.175-g sample is placed in a vial along with 4.489 g of methanol. Water in the vial extracts into the methanol. Analysis of the sample gave a peak height of 13.66. What is the %w/w H2O in the antibiotic?
12. Loconto and co-workers describe a method for determining trace levels of water in soil.18 The method takes advantage of the reaction of water with calcium carbide, CaC2, to produce acetylene gas, C2H2. By carrying out the reaction in a sealed vial, the amount of acetylene produced may be determined by sampling the headspace. In a typical analysis a sample of soil is placed in a sealed vial with CaC2. Analysis of the headspace gave a blank corrected signal of 2.70 × 10⁵. A second sample is prepared in the same manner except that a standard addition of 5.0 mg H2O/g solid is added, giving a blank-corrected signal of 1.06 × 10⁶. Determine the milligrams H2O/g soil in the soil sample.
13. Van Atta and Van Atta used gas chromatography to determine the %v/v methyl salicylate in rubbing alcohol.19 A set of standard additions was prepared by transferring 20.00 mL of rubbing alcohol to separate 25-mL volumetric flasks and pipeting 0.00 mL, 0.20 mL, and 0.50 mL of methyl salicylate to the flasks. All three flasks were then diluted to volume using isopropanol. Analysis of the three samples gave peak heights for methyl salicylate of 57.00 mm, 88.5 mm, and 132.5 mm, respectively. Determine the %v/v methyl salicylate in the rubbing alcohol.
14. The amount of camphor in an analgesic ointment can be determined by GC using the method of internal standards.20 A standard sample was prepared by placing 45.2 mg of camphor and 2.00 mL of a 6.00 mg/mL internal standard solution of terpene hydrate in a 25-mL volumetric flask and diluting to volume with CCl4. When an approximately 2-μL sample of the standard was injected, the FID signals for the two components were measured (in arbitrary units) as 67.3 for camphor and 19.8 for terpene hydrate. A 53.6-mg sample of an analgesic ointment was prepared for analysis by placing it in a 50-mL Erlenmeyer flask along with 10 mL of CCl4. After heating to 50oC in a water bath, the sample was cooled to below room temperature and filtered. The residue was washed with two 5-mL portions of CCl4 and the combined filtrates were collected in a 25-mL volumetric flask. After adding 2.00 mL of the internal standard solution, the contents of the flask were diluted to volume with CCl4. Analysis of an approximately 2-μL sample gave FID signals of 13.5 for the terpene hydrate and 24.9 for the camphor. Report the %w/w camphor in the analgesic ointment.
15. The concentration of pesticide residues on agricultural products, such as oranges, may be determined by GC-MS.21 Pesticide residues are extracted from the sample using methylene chloride and concentrated by evaporating the methylene chloride to a smaller volume. Calibration is accomplished using anthracene-d10 as an internal standard. In a study to determine the parts per billion heptachlor epoxide on oranges, a 50.0-g sample of orange rinds was chopped and extracted with 50.00 mL of methylene chloride. After removing any insoluble material by filtration, the methylene chloride was reduced in volume, spiked with a known amount of the internal standard and diluted to 10 mL in a volumetric flask. Analysis of the sample gives a peak–area ratio (Aanalyte/Aint std) of 0.108. A series of calibration standards, each containing the same amount of anthracene-d10 as the sample, gave the following results.
|
ppb heptachlor epoxide |
Aanalyte/Aint std |
|
20.0 |
0.065 |
|
60.0 |
0.153 |
|
200.0 |
0.637 |
|
500.0 |
1.554 |
|
1000.0 |
3.198 |
Report the nanograms per gram of heptachlor epoxide residue on the oranges.
Note
Anthracene consists of three fused aromatic rings and has the formula C14H10.
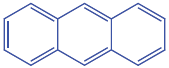
In anthracene-d10 all ten hydrogens are replaced with deuteriems.
16. The adjusted retention times for octane, toluene, and nonane on a particular GC column are 15.98 min, 17.73 min, and 20.42 min, respectively. What is the retention index for each compound?
17. The following data were collected for a series of normal alkanes using a stationary phase of Carbowax 20M.
|
alkane |
tr′ (min) |
|
pentane |
0.79 |
|
hexane |
1.99 |
|
heptane |
4.47 |
|
octane |
14.12 |
|
nonane |
33.11 |
What is the retention index for a compound whose adjusted retention time is 9.36 min?
18. The following data have been reported for the gas chromatographic analysis of p-xylene and methylisobutylketone (MIBK) on a capillary column.9
|
injection |
|
tr |
peak area |
peak width |
|
|
split |
MIBK |
1.878 |
54 285 |
0.028 |
|
|
|
p-xylene |
5.234 |
123 483 |
0.044 |
|
|
splitless |
MIBK |
3.420 |
2 493 005 |
1.057 |
|
|
|
p-xylene |
5.795 |
3 396 656 |
1.051 |
|
Explain the difference in the retention times, the peak areas, and the peak widths when switching from a split injection to a splitless injection.
19. Otto and Wegscheider report the following retention factors for the reversed-phase separation of 2-aminobenzoic acid on a C18 column when using 10% v/v methanol as a mobile phase.22
|
pH |
k |
|
2.0 |
10.5 |
|
3.0 |
16.7 |
|
4.0 |
15.8 |
|
5.0 |
8.0 |
|
6.0 |
2.2 |
|
7.0 |
1.8 |
Explain why pH affects the retention factor’s value.
20. Haddad and associates report the following retention factors for the reversed-phase separation of salicylamide and caffeine.
|
%v/v methanol |
30% |
35% |
40% |
45% |
50% |
55% |
|
ksal |
2.4 |
1.6 |
1.6 |
1.0 |
0.7 |
0.7 |
|
kcaff |
4.3 |
2.8 |
2.3 |
1.4 |
1.1 |
0.9 |
- Explain the trends in the retention factors for these compounds.
- What is the advantage of using a mobile phase with a smaller %v/v methanol? Are there any disadvantages?
21. Suppose you need to separate a mixture of benzoic acid, aspartame, and caffeine in a diet soda. The following information is available.
|
|
tr in aqueous mobile phase of pH |
|||
|
compound |
3.0 |
3.5 |
4.0 |
4.5 |
|
benzoic acid |
7.4 |
7.0 |
6.9 |
4.4 |
|
aspartame |
5.9 |
6.0 |
7.1 |
8.1 |
|
caffeine |
3.6 |
3.7 |
4.1 |
4.4 |
(a) Explain the change in retention time for each compound.
(b) Prepare a single graph showing the retention time versus pH for each compound. Using your plot, identify a pH level that will yield an acceptable separation.
22. The composition of a multivitamin tablet is conveniently determined using an HPLC with a diode array UV/Vis detector. A 5-μL standard sample containing 170 ppm vitamin C, 130 ppm niacin, 120 ppm niacinamide, 150 ppm pyridoxine, 60 ppm thiamine, 15 ppm folic acid, and 10 ppm riboflavin is injected into the HPLC, giving signals (in arbitrary units) of, respectively, 0.22, 1.35, 0.90, 1.37, 0.82, 0.36, and 0.29. The multivitamin tablet is prepared for analysis by grinding into a powder and transferring to a 125-mL Erlenmeyer flask containing 10 mL of 1% v/v NH3 in dimethyl sulfoxide. After sonicating in an ultrasonic bath for 2 min, 90 mL of 2% acetic acid is added and the mixture is stirred for 1 min and sonicated at 40oC for 5 min. The extract is then filtered through a 0.45-μm membrane filter. Injection of a 5-μL sample into the HPLC gives signals of 0.87 for vitamin C, 0.00 for niacin, 1.40 for niacinamide, 0.22 for pyridoxine, 0.19 for thiamine, 0.11 for folic acid, and 0.44 for riboflavin. Report the milligrams of each vitamin present in the tablet.
23. The amount of caffeine in an analgesic tablet was determined by HPLC using a normal calibration curve. Standard solutions of caffeine were prepared and analyzed using a 10-μL fixed-volume injection loop. Results for the standards are summarized in the following table.
|
concentration (ppm) |
signal (arb. units) |
|
50.0 |
8354 |
|
100.0 |
16925 |
|
150.0 |
25218 |
|
200.0 |
33584 |
|
250.0 |
42002 |
The sample was prepared by placing a single analgesic tablet in a small beaker and adding 10 mL of methanol. After allowing the sample to dissolve, the contents of the beaker, including the insoluble binder, were quantitatively transferred to a 25-mL volumetric flask and diluted to volume with methanol. The sample was then filtered, and a 1.00-mL aliquot was transferred to a 10-mL volumetric flask and diluted to volume with methanol. When analyzed by HPLC, the signal for caffeine was found to be 21 469. Report the milligrams of caffeine in the analgesic tablet.
24. Kagel and Farwell report a reversed-phase HPLC method for determining the concentration of acetylsalicylic acid (ASA) and caffeine (CAF) in analgesic tablets using salicylic acid (SA) as an internal standard.23 A series of standards was prepared by adding known amounts of acetylsalicylic acid and caffeine to 250-mL Erlenmeyer flasks and adding 100 mL of methanol. A 10.00-mL aliquot of a standard solution of salicylic acid was then added to each. The following results are obtained for a typical set of standard solutions.
| milligrams of | peak height ratios for | |||
| standard | ASA | CAF | ASA/SA | CAF/SA |
|
1 |
200.0 |
20.0 |
20.5 |
10.6 |
|
2 |
250.0 |
40.0 |
25.1 |
23.0 |
|
3 |
300.0 |
60.0 |
30.9 |
36.8 |
A sample of an analgesic tablet was placed in a 250-mL Erlenmeyer flask and dissolved in 100 mL of methanol. After adding a 10.00-mL portion of the internal standard, the solution was filtered. Analysis of the sample gave a peak height ratio of 23.2 for ASA and of 17.9 for CAF.
- Determine the milligrams of ASA and CAF in the tablet.
- Why was it necessary to filter the sample?
- The directions indicate that approximately 100 mL of methanol is used to dissolve the standards and samples. Why is it not necessary to measure this volume more precisely?
- In the presence of moisture, ASA decomposes to SA and acetic acid. What complication might this present for this analysis? How might you evaluate whether this is a problem?
25. Bohman and colleagues described a reversed-phase HPLC method for the quantitative analysis of vitamin A in food using the method of standard additions.24 In a typical example, a 10.067-g sample of cereal is placed in a 250-mL Erlenmeyer flask along with 1 g of sodium ascorbate, 40 mL of ethanol, and 10 mL of 50% w/v KOH. After refluxing for 30 min, 60 mL of ethanol is added and the solution cooled to room temperature. Vitamin A is extracted using three 100-mL portions of hexane. The combined portions of hexane are evaporated and the residue containing vitamin A transferred to a 5-mL volumetric flask and diluted to volume with methanol. A standard addition is prepared in a similar manner using a 10.093-g sample of the cereal and spiking with 0.0200 mg of vitamin A. Injecting the sample and standard addition into the HPLC gives peak areas of, respectively, 6.77 × 10³ and 1.32 × 10⁴. Report the vitamin A content of the sample in milligrams/100 g cereal.
26. Ohta and Tanaka reported an ion-exchange chromatographic method for the simultaneous analysis of several inorganic anions and the cations Mg2+ and Ca2+ in water.25 The mobile phase includes 1,2,4-benzenetricarboxylate, which absorbs strongly at 270 nm. Indirect detection of the analytes is possible because their presence in the detector leads to a decrease in absorbance. Unfortunately, Ca2+ and Mg2+, which are present at high concentrations in many environmental waters, form stable complexes with 1,2,4-benzenetricarboxylate that interfere with their analysis.
(a) The procedure calls for adding EDTA to the mobile phase. What role does the EDTA play in this analysis?
(b) A standard solution containing 1.0 M NaHCO3, 0.2 mM NaNO2, 0.2 mM MgSO4, 0.1 mM CaCl2, and 0.1 mM Ca(NO3)2 gives the following peak areas (arbitrary units).
|
ion |
HCO3– |
Cl– |
NO2– |
NO3– |
|
peak area |
373.5 |
322.5 |
264.8 |
262.7 |
|
ion |
Ca2+ |
Mg2+ |
SO42– |
|
|
peak area |
458.9 |
352.0 |
341.3 |
|
Analysis of a river water sample (pH of 7.49) gives the following results.
|
ion |
HCO3– |
Cl– |
NO2– |
NO3– |
|
peak area |
310.0 |
403.1 |
3.97 |
157.6 |
|
ion |
Ca2+ |
Mg2+ |
SO42– |
|
|
peak area |
734.3 |
193.6 |
324.3 |
|
Determine the concentration of each ion in the sample.
(c) The detection of HCO3– actually gives the total concentration of carbonate in solution ([CO32−] + [HCO3−] + [H2CO3]). Given that the pH of the water is 7.49, what is the actual concentration of HCO3–?
(d) An independent analysis gives the following additional concentrations for ions in the sample: [Na+] = 0.60 mM; [NH4+] = 0.014 mM; and [K+] = 0.046 mM. A solution’s ion balance is defined as the ratio of the total cation charge to the total anion charge. Determine the ion balance for this sample of water and comment on whether the result is reasonable.
27. The concentrations of Cl–, NO3–, and SO42– may be determined by ion chromatography. A 50-μL standard sample of 10.0 ppm Cl–, 2.00 ppm NO3–, and 5.00 ppm SO42– gave signals (in arbitrary units) of 59.3, 16.1, and 6.08 respectively. A sample of effluent from a wastewater treatment plant was diluted tenfold, and a 50 μL portion gave signals of 44.2 for Cl–, 2.73 for NO3–, and 5.04 for SO42–. Report the parts per million for each anion in the effluent sample.
28. A series of polyvinylpyridine standards of different molecular weight were analyzed by size-exclusion chromatography, yielding the following results.
|
formula weight |
retention volume (mL) |
|
600000 |
6.42 |
|
100000 |
7.98 |
|
20000 |
9.30 |
|
3000 |
10.94 |
When a preparation of polyvinylpyridine of unknown formula weight is analyzed, the retention volume is 8.45 mL. Report the average formula weight for the preparation.
29. Diet soft drinks contain appreciable quantities of aspartame, benzoic acid, and caffeine. What is the expected order of elution for these compounds in a capillary zone electrophoresis separation using a pH 9.4 buffer solution given that aspartame has pKa values of 2.964 and 7.37, benzoic acid has a pKa of 4.2, and the pKa for caffeine is less than 0. Figure 12.69 provides the structures of these compounds.

Figure 12.69 Structures for the compounds in Problem 12.29.
30. Janusa and coworkers describe the determination of chloride by CZE.26 Analysis of a series of external standards gives the following calibration curve.
\[\mathrm{area = −883 + 5590 × ppm\: Cl^−}\]
A standard sample of 57.22% w/w Cl– was analyzed by placing 0.1011-g portions in separate 100-mL volumetric flasks and diluting to volume. Three unknowns were prepared by pipeting 0.250 mL, 0.500 mL, and 0.750 mL of the bulk unknown in separate 50-mL volumetric flasks and diluting to volume. Analysis of the three unknowns gave areas of 15 310, 31 546, and 47 582, respectively. Evaluate the accuracy of this analysis.
31. The analysis of NO3– in aquarium water was carried out by CZE using IO4– as an internal standard. A standard solution of 15.0 ppm NO3– and 10.0 ppm IO4– gives peak heights (arbitrary units) of 95.0 and 100.1, respectively. A sample of water from an aquarium is diluted 1:100, and sufficient internal standard added to make its concentration 10.0 ppm. Analysis gives signals of 29.2 and 105.8 for NO3– and IO4–, respectively. Report the ppm NO3– in the sample of aquarium water.
32. Suggest conditions for separating a mixture of 2-aminobenzoic acid (pKa1 = 2.08, pKa2 = 4.96), benzylamine (pKa = 9.35), and 4-methylphenol (pKa2 = 10.26) by capillary zone electrophoresis. Figure 12.70 provides the structures of these compounds.
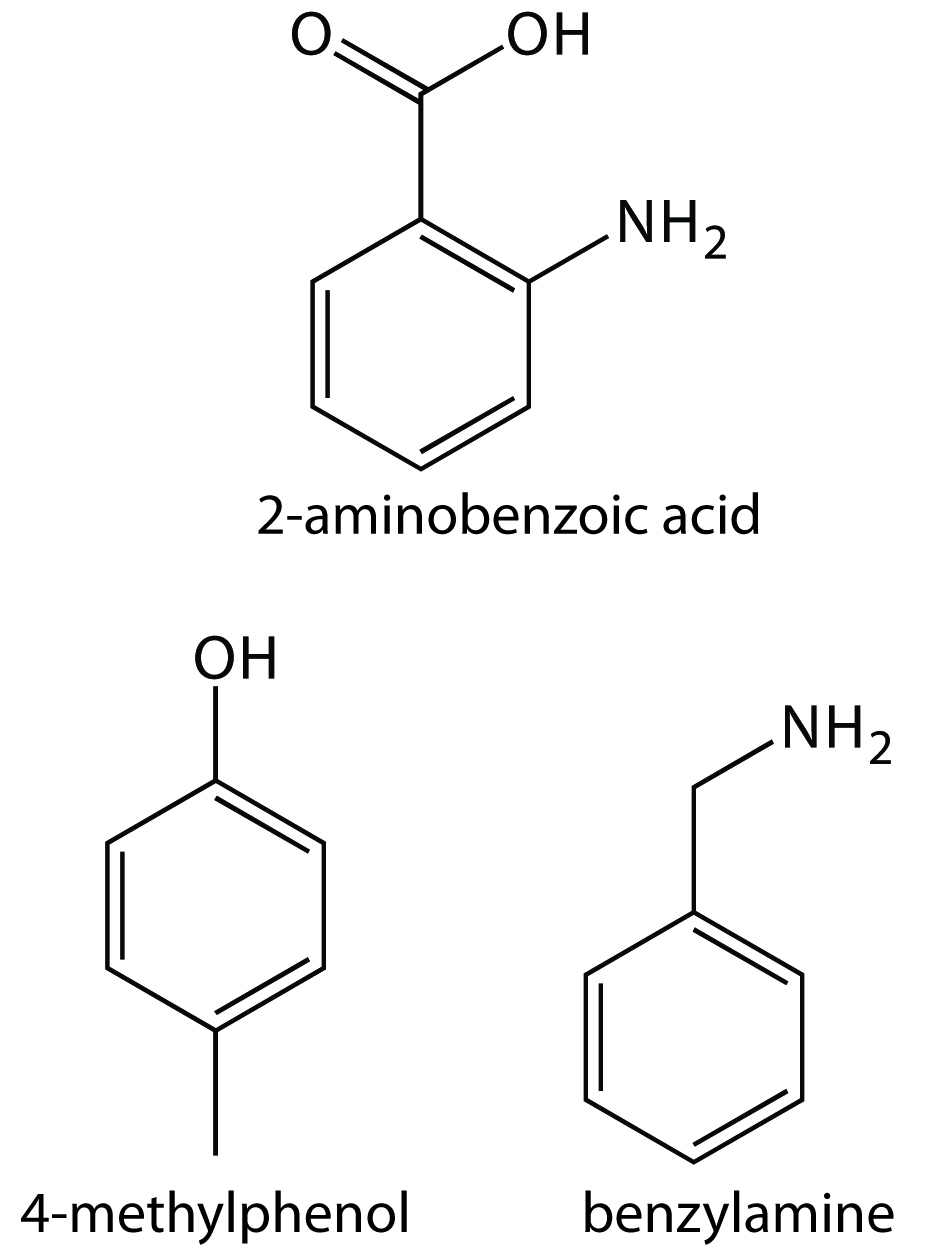
Figure 12.70 Structures for the compounds in Problem 12.32.
33. McKillop and associates examined the electrophoretic separation of some alkylpyridines by CZE.27 Separations were carried out using either 50-μm or 75-μm inner diameter capillaries, with a total length of 57 cm and a length of 50 cm from the point of injection to the detector. The run buffer was a pH 2.5 lithium phosphate buffer. Separations were achieved using an applied voltage of 15 kV. The electroosmotic flow velocity, as measured using a neutral marker, was found to be 6.398 × 10⁻⁵ cm2 V–1 s–1.
(a) Calculate the electrophoretic mobility for 2-ethylpyridine given that its elution time is 8.20 min.
(b) How many theoretical plates are there for 2-ethylpyridine?
(c) The electrophoretic mobilities for 3-ethylpyridine and 4-ethylpyridine are 3.366 × 10⁻⁴ cm2 V–1 s–1 and 3.397 x × 10–4 cm2 V–1 s–1, respectively. What is the expected resolution between these two alkylpyridines?
(d) Explain the trends in electrophoretic mobility shown in the following table.
|
alkylpyridine |
μep (cm2 V–1 s–1) |
|
2-methylpyridine |
3.581×10⁻⁴ |
|
2-ethylpyridine |
3.222×10⁻⁴ |
|
2-propylpyridine |
2.923×10⁻⁴ |
|
2-pentylpyridine |
2.534×10⁻⁴ |
|
2-hexylpyridine |
2.391×10⁻⁴ |
(e) Explain the trends in electrophoretic mobility shown in the following table.
| alkylpyridine | μep (cm2 V–1 s–1) |
| 2-ethylpyridine | 3.222 × 10⁻⁴ |
| 3-ethylpyridine | 3.366 × 10⁻⁴ |
| 4-ethylpyridine | 3.397 × 10⁻⁴ |
(f) The pKa for pyridine is 5.229. At a pH of 2.5 the electrophoretic mobility of pyridine is 4.176 × 10⁻⁴ cm2 V–1 s–1. What is the expected electrophoretic mobility if the run buffer’s pH is 7.5?
12.8.3 Solutions to Practice Exercises
Practice Exercise 12.1
Because the relationship between elution time and distance is proportional, we can measure ∆tr, wA, and wB using a ruler. My measurements are 8.5 mm for ∆tr, and 12.0 mm each for wA and wB. Using these values, the resolution is
\[R_\ce{AB} = \dfrac{2\Delta t_\ce{r}}{w_\ce{A} + w_\ce{B}} = \mathrm{\dfrac{2(8.5\: mm)}{12.0\: mm + 12.0\: mm} = 0.70}\]
Note
The data for this exercise were created so that the actual resolution is 0.75. Given the resolution of my ruler’s scale, my answer is a pretty reasonable. Your measurements may be slightly different, but your answer should be close to the actual value.
Click here to return to the chapter.
Practice Exercise 12.2
Because the relationship between elution time and distance is proportional, we can measure tm, tr,1, and tr,2 using a ruler. My measurements are 7.8 mm, 40.2 mm, and 51.5 mm, respectively. Using these values, the retention factors for solute A and solute B are
\[k_1 = \dfrac{t_\ce{r} − t_\ce{m}}{t_\ce{m}} = \mathrm{\dfrac{40.2\: mm − 7.8\: mm}{7.8\: mm} = 4.15}\]
\[k_2 =\dfrac{t_\ce{r} − t_\ce{m}}{t_\ce{m}} = \mathrm{\dfrac{51.5\: mm − 7.8\: mm}{7.8\: mm} = 5.60}\]
Note
The data for this exercise were created so that the actual retention factors are 4 for solute 1 and 5.5 for solute 2. Given the resolution of my ruler’s scale, my answers are pretty reasonable. Your measurements may be slightly different, but your answers should be close to the actual values.
Click here to return to the chapter.
Practice Exercise 12.3
Using the results from Practice Exercise 12.2, the selectivity factor is
\[α = \dfrac{k_2}{k_1} = \dfrac{5.60}{4.15} = 1.35\]
Your answer may differ slightly due to differences in your values for the two retention factors.
Note
The data for this exercise were created so that the actual selectivity factor is 1.375. Given the resolution of my ruler’s scale, my answer is pretty reasonable. Your measurements may be slightly different, but your answer should be close to the actual values.
Click here to return to the chapter.
Practice Exercise 12.4
Because the relationship between elution time and distance is proportional, we can measure tr,1, tr,2, w1, and w2 using a ruler. My measurements are 40.2 mm, 51.5 mm, 8.0 mm, and 13.5 mm, respectively. Using these values, the number of theoretical plates for each solute is
\[N_1 = 16\dfrac{t_\textrm{r,1}^2}{w_1^2} = \mathrm{16\dfrac{(40.2\: mm)^2}{(8.0\: mm)^2} = 400\: theoretical\: plates}\]
\[N_2= 16\dfrac{t_\textrm{r,2}^2}{w_2^2} = \mathrm{16\dfrac{(51.5\: mm)^2}{(13.5\: mm)^2} = 233\: theoretical\: plates}\]
Note
The data for this exercise were created so that the actual number of theoretical plates is 400 for solute 1 and 264 for solute 2. Given the resolution of my ruler’s scale, my answer is pretty reasonable. Your measurements may be slightly different, but your answers should be close to the actual values.
The height of a theoretical plate for each solute is
\[H_1 = \dfrac{L}{N_1} = \mathrm{\dfrac{0.500\: m}{400\: plates} × \dfrac{1000\: mm}{m} = 1.2\: mm/plate}\]
\[H_2 = \dfrac{L}{N_2} = \mathrm{\dfrac{0.500\: m}{233\: plates} × \dfrac{1000\: mm}{m} = 2.15\: mm/plate}\]
Click here to return to the chapter.
Practice Exercise 12.5
The following table summarizes my measurements of the peak heights for each standard and the sample.
| peak heights (mm) | |||
| [standard] (mg/mL) | internal standard | analyte | peak height ratio |
| 0.20 | 35 | 7 | 0.20 |
| 0.40 | 41 | 16 | 0.39 |
| 0.60 | 44 | 27 | 0.61 |
| 0.80 | 48 | 39 | 0.81 |
| 1.00 | 41 | 41 | 1.00 |
| sample | 39 | 21 | 0.54 |
Figure 12.71a shows the calibration curve and calibration equation when we ignore the internal standard. Substituting the sample’s peak height into the calibration equation gives the analyte’s concentration in the sample as 0.49 mg/mL. The 95% confidence interval is ±0.24 mg/mL. The calibration curve shows quite a bit of scatter in the data because of uncertainty in the injection volumes.
Figure 12.71b shows the calibration curve and calibration equation when we include the internal standard. Substituting the sample’s peak height ratio into the calibration equation gives the analyte’s concentration in the sample as 0.54 mg/mL. The 95% confidence interval is ±0.04 mg/mL.
Note
The data for Practice Exercise 12.5 were created so that the analyte’s actual concentration is 0.55 mg/mL. Given the resolution of my ruler’s scale, my answer is pretty reasonable. Your measurements may be slightly different, but your answers should be close to the actual values.
To review the use of Excel or R for regression calculations and confidence intervals, see Chapter 5.5.
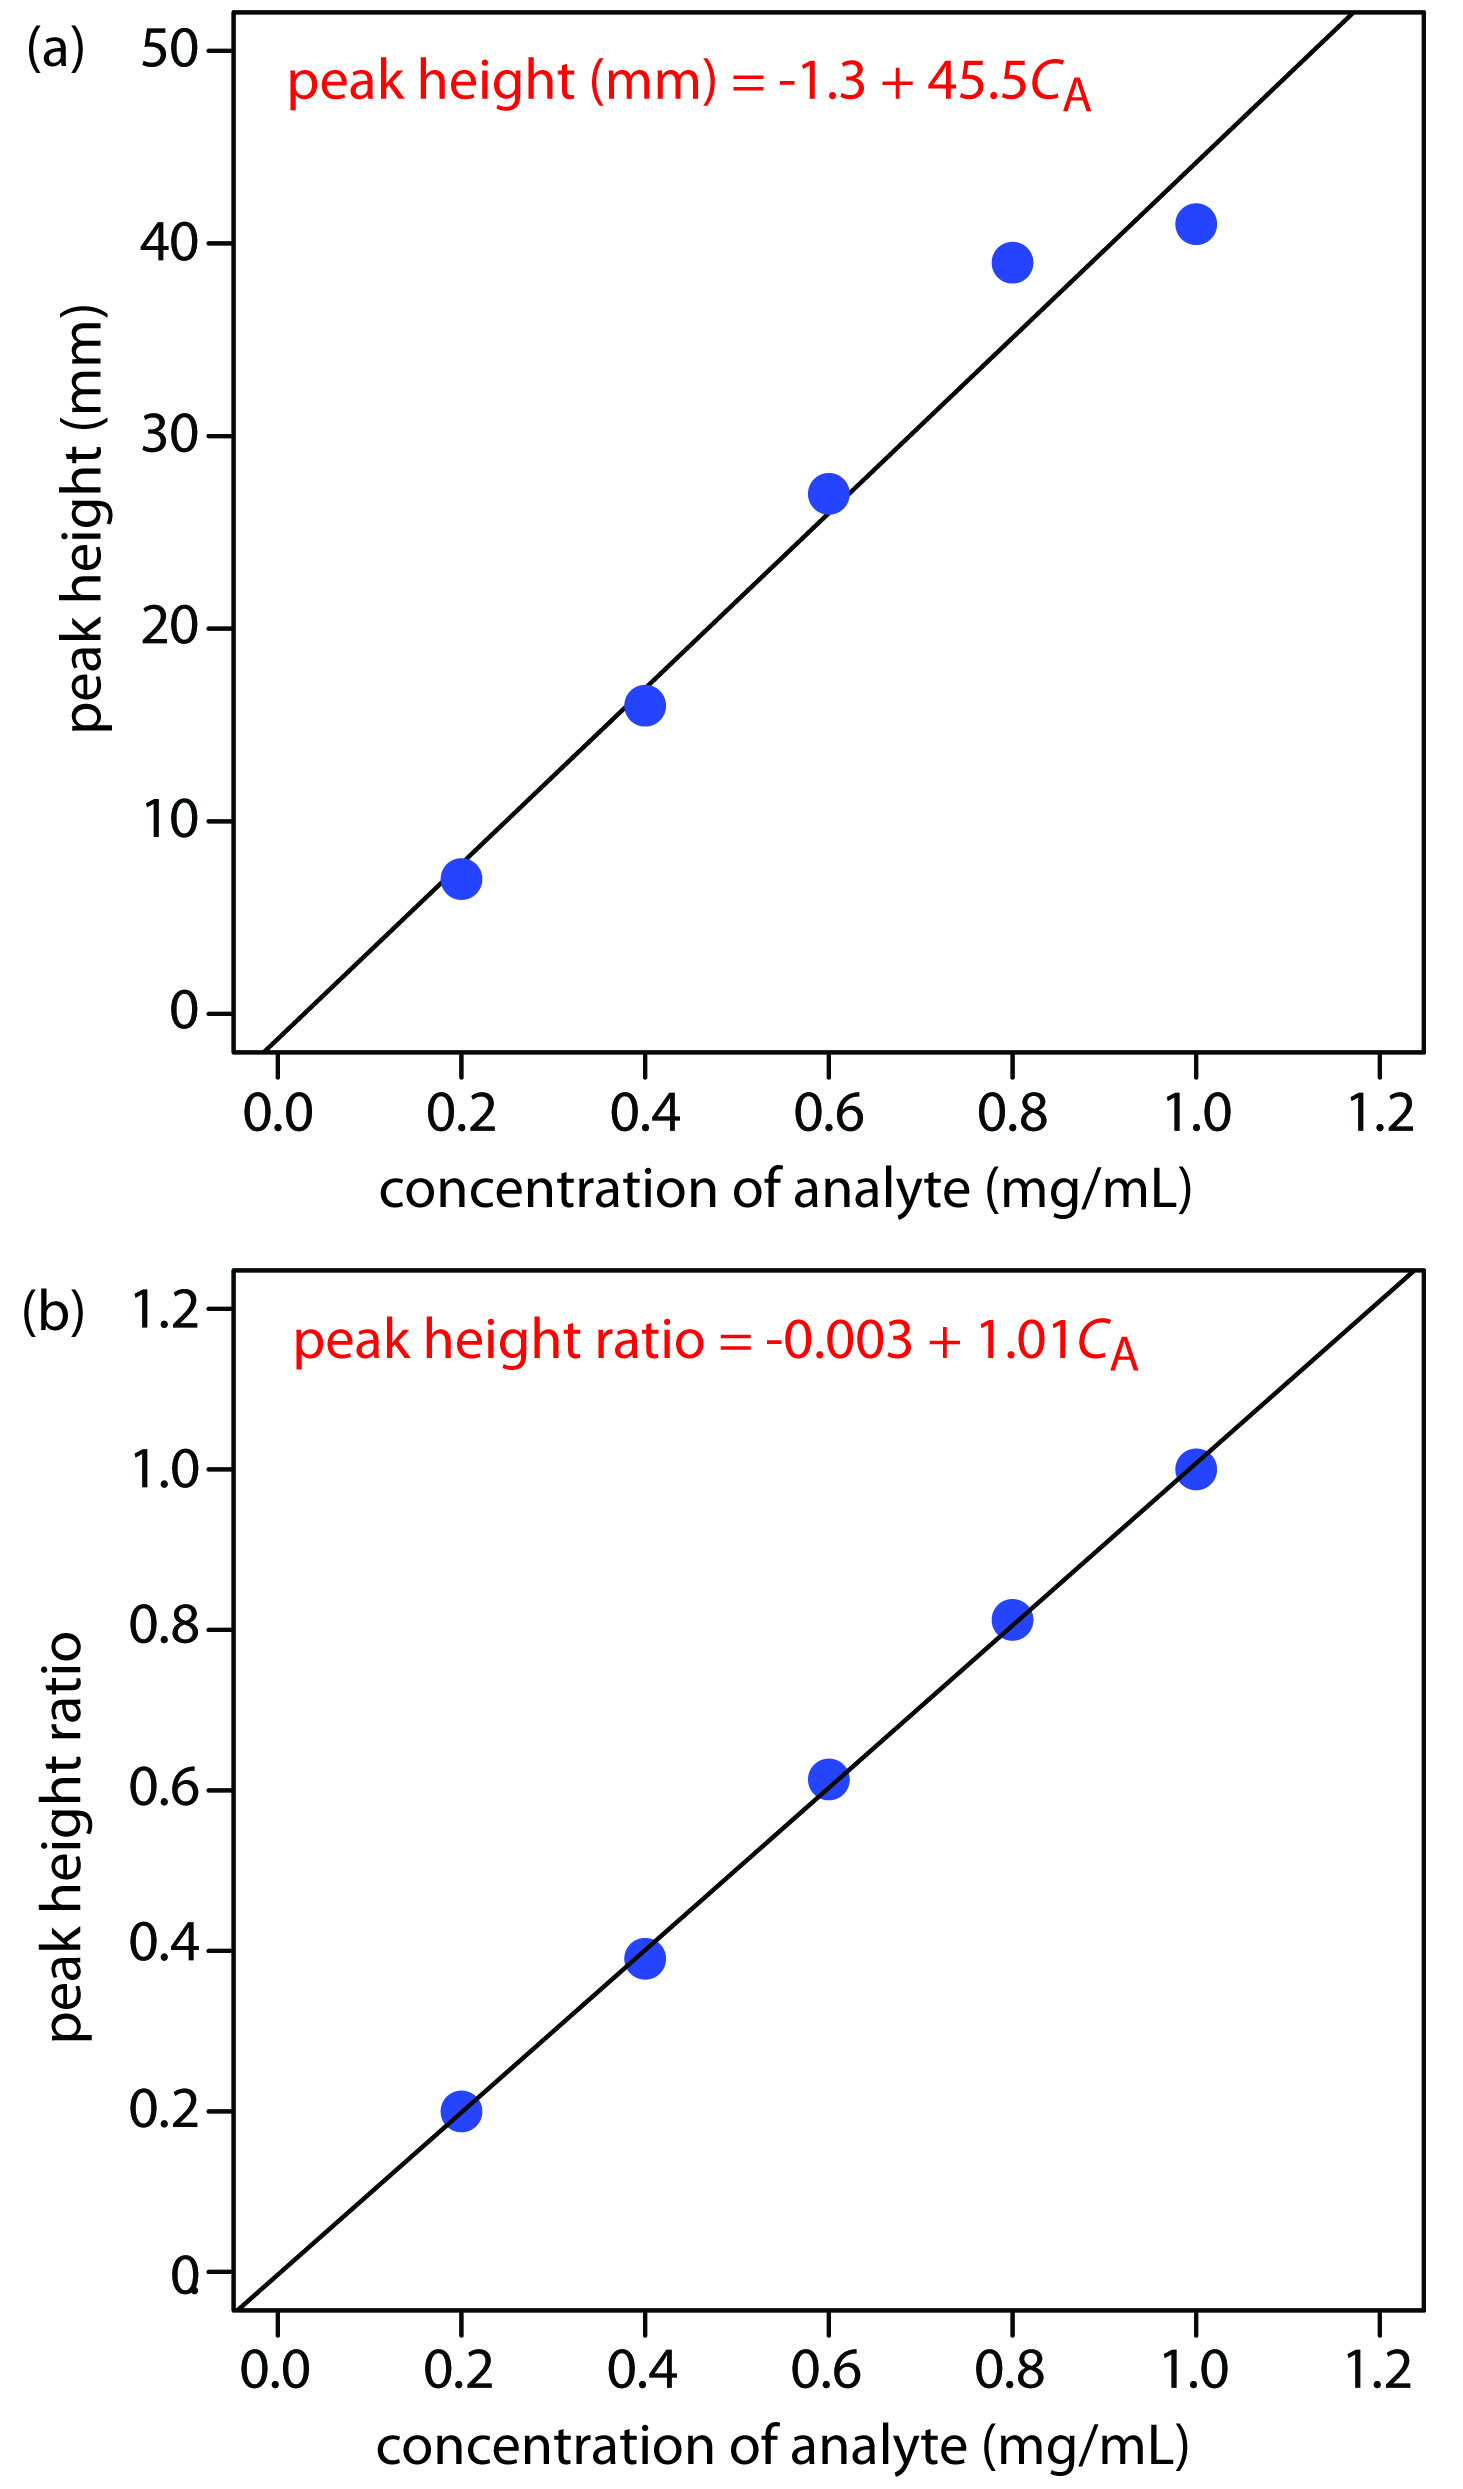
Figure 12.71 Calibration curves for the data in Practice Exercise 12.5.
Click here to return to the chapter.
Practice Exercise 12.6
Because we are using the same column we can assume that isobutane’s retention index of 386 remains unchanged. Using equation 12.27, we have
\[386 = 100 × \dfrac{\log x - \log(4.78)}{\log(6.86) - \log(4.78)} + 300\]
where x is the retention time for isobutane. Solving for x, we find that
\[0.86 = \dfrac{\log x - 0.679}{0.836 - 0.679}\]
\[0.135 = \log x - 0.679\]
\[0.814 = \log x\]
\[x = 6.52\]
the retention time for isobutane is 6.52 min.
Click here to return to the chapter.
Practice Exercise 12.7
If we let x be the fraction of water in the mobile phase, then 1 – x is the fraction of methanol. Substituting these values into equation 12.28 and solving for x
\[7.5 = 10.2x + 5.1 × (1 - x)\]
\[7.5 = 10.2x + 5.1 - 5.1x\]
\[2.4 = 5.1x\]
gives x as 0.47. The mobile phase is 47% v/v water and 53% v/v methanol.
Click here to return to the chapter.
Practice Exercise 12.8
Figure 12.72 shows the calibration curve and calibration equation for the set of external standards. Substituting the sample’s peak area into the calibration equation gives the concentration of caffeine in the sample as 94.4 mg/L.

Figure 12.72 Calibration curves for the data in Practice Exercise 12.8.
Click here to return to the chapter.
Practice Exercise 12.9
The capillary is 75 cm long, which means that 0.20% of that sample’s maximum length is 0.15 cm. To convert this to the maximum volume of sample we use the equation for the volume of a cylinder.
\[V_\ce{inj} = lπr^2 = \mathrm{(0.15\: cm)(3.14)(25×10^{−4}\: cm)^2 = 2.94×10^{−6}\: cm^3}\]
Given that 1 cm3 is equivalent to 1 mL, the maximum volume is 2.94 × 10⁻⁶ mL of 2.94× 10⁻⁹ L. To find the maximum injection time, we first solve equation 12.45 for t
\[t = \dfrac{128V_\ce{inj}ηL}{Pd^4π} × \mathrm{10^{−3}\: m^3/L}\]
and then make appropriate substitutions.
\[t = \mathrm{\dfrac{(128)(2.94×10^{-9}\: L)(0.001\: kg\: m^{-1}\: s^{-1})(0.75\: m)}{2.5×10^3\: kg\: m^{-1}\: s^{-2})(50×10^{-6}\: m)^4(3.14)} × \dfrac{10^{-3}\: m^3}{L} = 5.8\: s}\]
The maximum injection time, therefore, is 5.8 s.
Click here to return to the chapter.