
12.8: Infrared Spectra of Some Common Functional Groups
- Page ID
- 67284
Objective
After completing this section, you should be able to use an infrared spectrum to determine the presence of functional groups, such as alcohols, amines and carbonyl groups, in an unknown compound, given a list of infrared absorption frequencies.
In Chapter 12.7, you should have learned, in broad terms, where a few key absorptions occur. Otherwise, to find the characteristic infrared absorptions of the various functional groups, refer to this IR table.
Spectral Interpretation by Application of Group Frequencies
One of the most common application of infrared spectroscopy is to the identification of organic compounds. The major classes of organic molecules are shown in this category and also linked on the bottom page for the number of collections of spectral information regarding organic molecules.
Hydrocarbons
Hydrocarbons compounds contain only C-H and C-C bonds, but there is plenty of information to be obtained from the infrared spectra arising from C-H stretching and C-H bending.
In alkanes, which have very few bands, each band in the spectrum can be assigned:
- C–H stretch from 3000–2850 cm-1
- C–H bend or scissoring from 1470-1450 cm-1
- C–H rock, methyl from 1370-1350 cm-1
- C–H rock, methyl, seen only in long chain alkanes, from 725-720 cm-1
Figure 3. shows the IR spectrum of octane. Since most organic compounds have these features, these C-H vibrations are usually not noted when interpreting a routine IR spectrum. Note that the change in dipole moment with respect to distance for the C-H stretching is greater than that for others shown, which is why the C-H stretch band is the more intense.
.png?revision=1&size=bestfit&width=548&height=282)
Figure 3. Infrared Spectrum of Octane
In alkenes compounds, each band in the spectrum can be assigned:
- C=C stretch from 1680-1640 cm-1
- =C–H stretch from 3100-3000 cm-1
- =C–H bend from 1000-650 cm-1
Figure 4. shows the IR spectrum of 1-octene. As alkanes compounds, these bands are not specific and are generally not noted because they are present in almost all organic molecules.
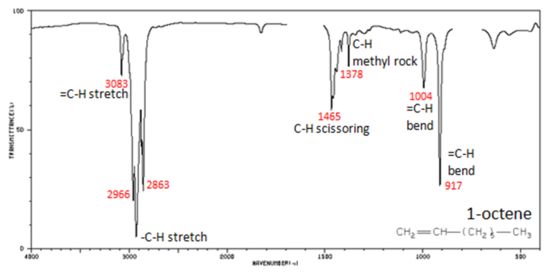
Figure 4. Infrared Spectrum of 1-Octene
In alkynes, each band in the spectrum can be assigned:
- –C≡C– stretch from 2260-2100 cm-1
- –C≡C–H: C–H stretch from 3330-3270 cm-1
- –C≡C–H: C–H bend from 700-610 cm-1
The spectrum of 1-hexyne, a terminal alkyne, is shown below.
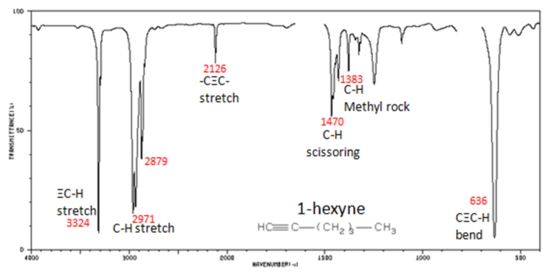
Figure 5. Infrared Spectrum of 1-Hexyne
In aromatic compounds, each band in the spectrum can be assigned:
- C–H stretch from 3100-3000 cm-1
- overtones, weak, from 2000-1665 cm-1
- C–C stretch (in-ring) from 1600-1585 cm-1
- C–C stretch (in-ring) from 1500-1400 cm-1
- C–H "oop" from 900-675 cm-1
Note that this is at slightly higher frequency than is the –C–H stretch in alkanes. This is a very useful tool for interpreting IR spectra. Only alkenes and aromatics show a C–H stretch slightly higher than 3000 cm-1.
Figure 6. shows the spectrum of toluene.
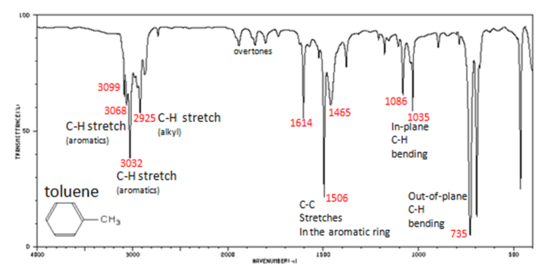
Figure 6. Infrared Spectrum of Toluene
Functional Groups Containing the C-O Bond
Alcohols have IR absorptions associated with both the O-H and the C-O stretching vibrations.
- O–H stretch, hydrogen bonded 3500-3200 cm-1
- C–O stretch 1260-1050 cm-1 (s)
Figure 7. shows the spectrum of ethanol. Note the very broad, strong band of the O–H stretch.
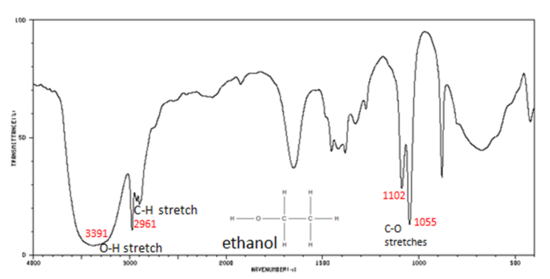
Figure 7. Infrared Spectrum of Ethanol
The carbonyl stretching vibration band C=O of saturated aliphatic ketones appears:
- C=O stretch - aliphatic ketones 1715 cm-1
- α, β -unsaturated ketones 1685-1666 cm-1
Figure 8. shows the spectrum of 2-butanone. This is a saturated ketone, and the C=O band appears at 1715.
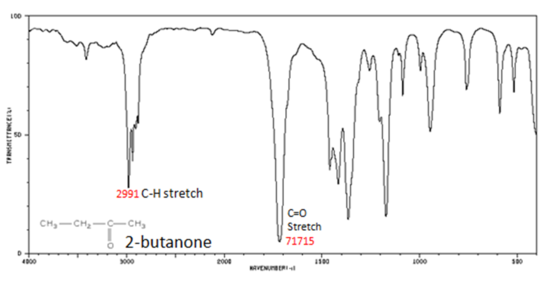
Figure 8. Infrared Spectrum of 2-Butanone
If a compound is suspected to be an aldehyde, a peak always appears around 2720 cm-1 which often appears as a shoulder-type peak just to the right of the alkyl C–H stretches.
- H–C=O stretch 2830-2695 cm-1
- C=O stretch:
- aliphatic aldehydes 1740-1720 cm-1
- α, β-unsaturated aldehydes 1710-1685 cm-1
Figure 9. shows the spectrum of butyraldehyde.
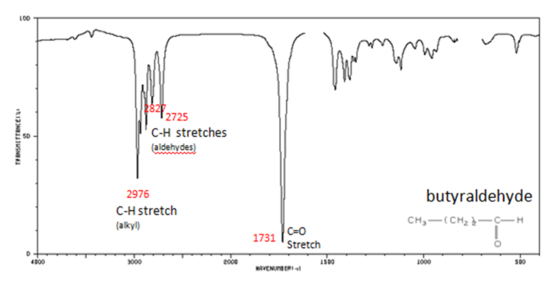
Figure 9. Infrared Spectrum of Butyraldehyde
The carbonyl stretch C=O of esters appears:
- C=O stretch
- aliphatic from 1750-1735 cm-1
- α, β -unsaturated from 1730-1715 cm-1
- C–O stretch from 1300-1000 cm-1
Figure 10. shows the spectrum of ethyl benzoate.
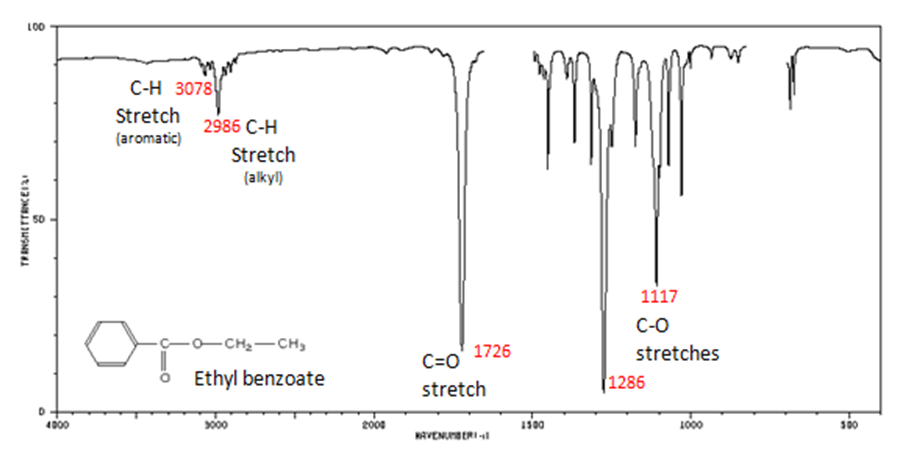
Figure 10. Infrared Spectrum of Ethyl benzoate
The carbonyl stretch C=O of a carboxylic acid appears as an intense band from 1760-1690 cm-1. The exact position of this broad band depends on whether the carboxylic acid is saturated or unsaturated, dimerized, or has internal hydrogen bonding.
- O–H stretch from 3300-2500 cm-1
- C=O stretch from 1760-1690 cm-1
- C–O stretch from 1320-1210 cm-1
- O–H bend from 1440-1395 and 950-910 cm-1
Figure 11. shows the spectrum of hexanoic acid.
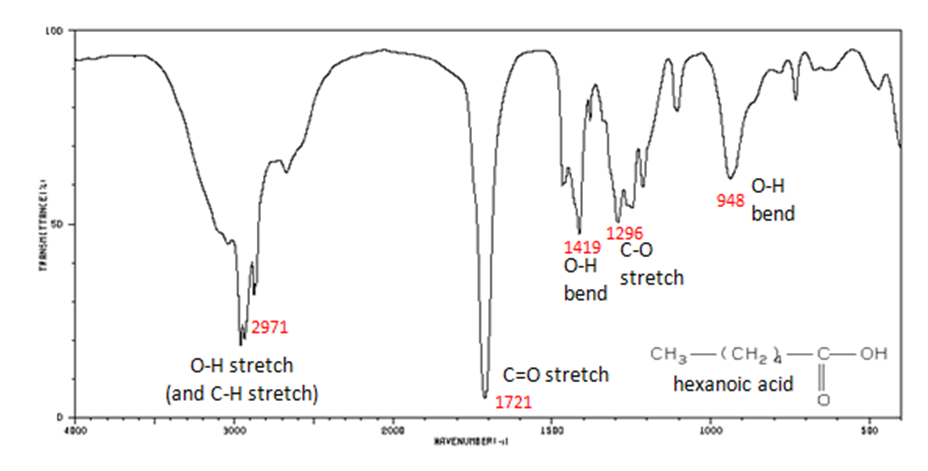
Figure 11. Infrared Spectrum of Hexanoic acid
Organic Nitrogen Compounds
- N–O asymmetric stretch from 1550-1475 cm-1
- N–O symmetric stretch from 1360-1290 cm-1
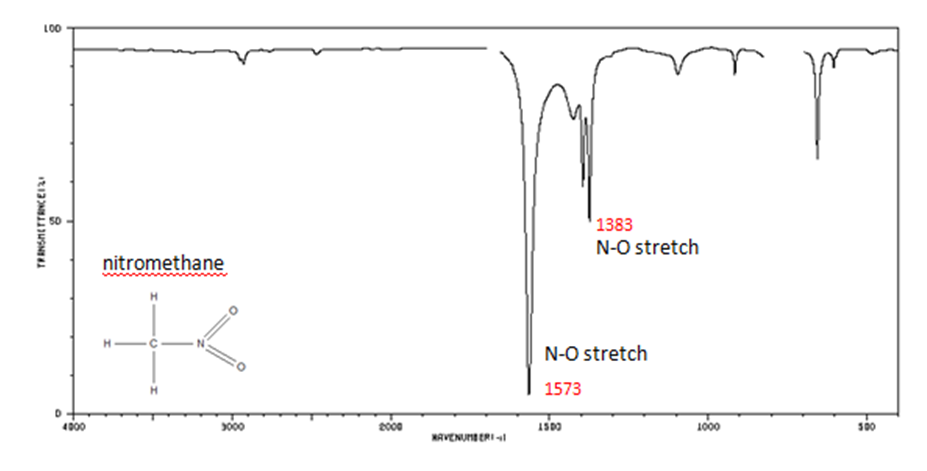
Figure 12. Infrared Spectrum of Nitomethane
Organic Compounds Containing Halogens
Alkyl halides are compounds that have a C–X bond, where X is a halogen: bromine, chlorine, fluorene, or iodine.
- C–H wag (-CH2X) from 1300-1150 cm-1
- C–X stretches (general) from 850-515 cm-1
- C–Cl stretch 850-550 cm-1
- C–Br stretch 690-515 cm-1
The spectrum of 1-chloro-2-methylpropane are shown below.
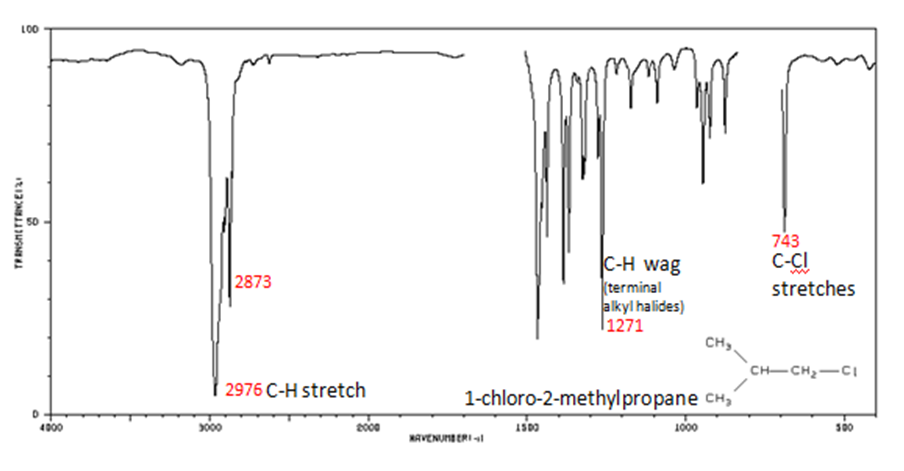
Figure 13. Infrared Spectrum of 1-chloro-2-methylpropane
For more Infrared spectra Spectral database of organic molecules is introduced to use free database. Also, the infrared spectroscopy correlation table is linked on bottom of page to find other assigned IR peaks.
Exercises
The following spectrum is for the accompanying compound. What are the peaks that you can identify?
- Answer
-
Frequency (cm-1) Functional Group
3200 C≡C-H
2900-3000 C-C-H, C=C-H
2100 C≡C
1610 C=C
(There is also an aromatic undertone region between 2000-1600 which describes the substitution on the phenyl ring.)
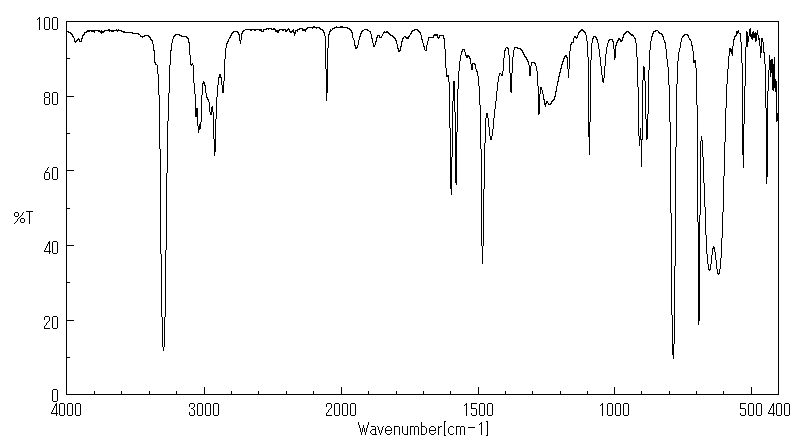
What absorptions would the following compounds have in an IR spectra?
.png?revision=1&size=bestfit&width=391&height=306)
- Answer
-
A
Frequency (cm-1) Functional Group
2900-3000 C-C-H, C=C-H
1710 C=O
1610 C=C
1100 C-O
B
Frequency (cm-1) Functional Group
3200 C≡C-H
2900-3000 C-C-H, C=C-H
2100 C≡C
1710 C=O
C
Frequency (cm-1) Functional Group
3300 (broad) O-H
2900-3000 C-C-H, C=C-H
2000-1800 Aromatic Overtones
1710 C=O
1610 C=C
Contributors and Attributions
Dr. Dietmar Kennepohl FCIC (Professor of Chemistry, Athabasca University)
Prof. Steven Farmer (Sonoma State University)
William Reusch, Professor Emeritus (Michigan State U.), Virtual Textbook of Organic Chemistry