
Infrared Spectroscopy
- Page ID
- 1847
Infrared (IR) spectroscopy is one of the most common and widely used spectroscopic techniques employed mainly by inorganic and organic chemists due to its usefulness in determining structures of compounds and identifying them. Chemical compounds have different chemical properties due to the presence of different functional groups.
Introduction
Infrared (IR) spectroscopy is one of the most common and widely used spectroscopic techniques. Absorbing groups in the infrared region absorb within a certain wavelength region. The absorption peaks within this region are usually sharper when compared with absorption peaks from the ultraviolet and visible regions. In this way, IR spectroscopy can be very sensitive to determination of functional groups within a sample since different functional group absorbs different particular frequency of IR radiation. Also, each molecule has a characteristic spectrum often referred to as the fingerprint. A molecule can be identified by comparing its absorption peak to a data bank of spectra. IR spectroscopy is very useful in the identification and structure analysis of a variety of substances, including both organic and inorganic compounds. It can also be used for both qualitative and quantitative analysis of complex mixtures of similar compounds.
The use of infrared spectroscopy began in the 1950's by Wilbur Kaye. He had designed a machine that tested the near-infrared spectrum and provided the theory to describe the results. Karl Norris started using IR Spectroscopy in the analytical world in the 1960's and as a result IR Spectroscopy became an accepted technique. There have been many advances in the field of IR Spec, the most notable was the application of Fourier Transformations to this technique thus creating an IR method that had higher resolution and a decrease in noise. The year this method became accepted in the field was in the late 1960's.4
Absorption Spectroscopy
There are three main processes by which a molecule can absorb radiation. and each of these routes involves an increase of energy that is proportional to the light absorbed. The first route occurs when absorption of radiation leads to a higher rotational energy level in a rotational transition. The second route is a vibrational transition which occurs on absorption of quantized energy. This leads to an increased vibrational energy level. The third route involves electrons of molecules being raised to a higher electron energy, which is the electronic transition. It’s important to state that the energy is quantized and absorption of radiation causes a molecule to move to a higher internal energy level. This is achieved by the alternating electric field of the radiation interacting with the molecule and causing a change in the movement of the molecule. There are multiple possibilities for the different possible energy levels for the various types of transitions.
The energy levels can be rated in the following order: electronic > vibrational > rotational. Each of these transitions differs by an order of magnitude. Rotational transitions occur at lower energies (longer wavelengths) and this energy is insufficient and cannot cause vibrational and electronic transitions but vibrational (near infra-red) and electronic transitions (ultraviolet region of the electromagnetic spectrum) require higher energies.
.png?revision=1)
The energy of IR radiation is weaker than that of visible and ultraviolet radiation, and so the type of radiation produced is different. Absorption of IR radiation is typical of molecular species that have a small energy difference between the rotational and vibrational states. A criterion for IR absorption is a net change in dipole moment in a molecule as it vibrates or rotates. Using the molecule HBr as an example, the charge distribution between hydrogen and bromine is not evenly distributed since bromine is more electronegative than hydrogen and has a higher electron density. \(HBr\) thus has a large dipole moment and is thus polar. The dipole moment is determined by the magnitude of the charge difference and the distance between the two centers of charge. As the molecule vibrates, there is a fluctuation in its dipole moment; this causes a field that interacts with the electric field associated with radiation. If there is a match in frequency of the radiation and the natural vibration of the molecule, absorption occurs and this alters the amplitude of the molecular vibration. This also occurs when the rotation of asymmetric molecules around their centers results in a dipole moment change, which permits interaction with the radiation field.
Molecules such as O2, N2, Br2, do not have a changing dipole moment (amplitude nor orientation) when they undergo rotational and vibrational motions, as a result, they cannot cannot absorb IR radiation.
Diatomic Molecular Vibration
The absorption of IR radiation by a molecule can be likened to two atoms attached to each other by a massless spring. Considering simple diatomic molecules, only one vibration is possible. The Hook's law potential on the other hand is based on an ideal spring
\[\begin{align} F &= -kx \label{1} \\[4pt] &= -\dfrac{dV(x)}{dx} \label{2} \end{align}\]
this results in one dimensional space
\[ V(r) = \dfrac{1}{2} k(r-r_{eq})^2 \label{3}\]
One thing that the Morse and Harmonic oscillator have in common is the small displacements (\(x=r-r_{eq}\)) from the equilibrium. Solving the Schrödinger equation for the harmonic oscillator potential results in the energy levels results in
\[ E_v = \left(v+\dfrac{1}{2}\right)hv_e \label{4}\]
with \(v=0,1,2,3,...,\,infinity\)
\[ v_e = \dfrac{1}{2\pi} \sqrt{\dfrac{k}{\mu}} \label{5}\]
When calculating the energy of a diatomic molecule, factors such as anharmonicity (has a similar curve with the harmonic oscillator at low potential energies but deviates at higher energies) are considered. The energy spacing in the harmonic oscillator is equal but not so with the anharmonic oscillator. The anharmonic oscillator is a deviation from the harmonic oscillator. Other considered terms include; centrifugal stretching, vibrational and rotational interactions have to be taken into account. The energy can be expressed mathematically as
\[ E_v = \underset{\text{Harmonic Oscillator}}{\left(v+\dfrac{1}{2}\right)hv_e} - \underset{\text{anharmonicity}}{\left(v+\dfrac{1}{2}\right)^2 X_e hv_e} + \underset{\text{Rigid Rotor}}{B_e J (J+1)} - \underset{\text{centrifugal stretching}}{D_e J^2 (J+1)^2} -\alpha_e \underset{\text{rovibrational coupling}}{\left(v+\dfrac{1}{2}\right) J(J+1)} \label{6}\]
The first and third terms represent the harmonicity and rigid rotor behavior of a diatomic molecule such as HCl. The second term represents anharmonicity and the fourth term represents centrifugal stretching. The fifth term represents the interaction between the vibration and rotational interaction of the molecule.
Polyatomic Molecular Vibration
The bond of a molecule experiences various types of vibrations and rotations. This causes the atom not to be stationary and to fluctuate continuously. Vibrational motions are defined by stretching and bending modes. These movements are easily defined for diatomic or triatomic molecules. This is not the case for large molecules due to several vibrational motions and interactions that will be experienced. When there is a continuous change in the interatomic distance along the axis of the bond between two atoms, this process is known as a stretching vibration. A change in the angle occurring between two bonds is known as a bending vibration. Four bending vibrations exist namely, wagging, twisting, rocking and scissoring. A CH2 group is used as an example to illustrate stretching and bending vibrations below.


Symmetric Stretch Asymmetric Stretch Twisting


Wagging Scissoring Rocking
Figure 3: Types of Vibrational Modes. To ensure that no center of mass motion occurs, the center atom (yellow ball) will also move. Figure from Wikipedia
As stated earlier, molecular vibrations consist of stretching and bending modes. A molecule consisting of (N) number of atoms has a total of 3N degrees of freedom, corresponding to the Cartesian coordinates of each atom in the molecule. In a non-linear molecule, 3 of these degrees of freedom are rotational, 3 are translational and the remainder is fundamental vibrations. In a linear molecule, there are 3 translational degrees of freedom and 2 are rotational. This is because in a linear molecule, all of the atoms lie on a single straight line and hence rotation about the bond axis is not possible. Mathematically the normal modes for a linear and non linear can be expressed as
Linear Molecules: (3N - 5) degrees of freedom
Non-Linear molecules: (3N - 6) degrees of freedom
Diagram of Stretching and Bending Modes for H2O.
Solution
H2O molecule is a non-linear molecule due to the uneven distribution of the electron density. O2 is more electronegative than H2 and carries a negative charge, while H has a partial positive charge. The total degrees of freedom for H2O will be 3(3)-6 = 9-6 = 3 degrees of freedom which correspond to the following stretching and bending vibrations. The vibrational modes are illustrated below:
Diagram of Stretching and Bending Modes for CO2.
Solution
CO2 is a linear molecule and thus has the formula (3N-5). It has 4 modes of vibration (3(3)-5). CO2 has 2 stretching modes, symmetric and asymmetric. The CO2 symmetric stretch is not IR active because there is no change in dipole moment because the net dipole moments are in opposite directions and as a result, they cancel each other. In the asymmetric stretch, O atom moves away from the C atom and generates a net change in dipole moments and hence absorbs IR radiation at 2350 cm-1. The other IR absorption occurs at 666 cm-1. CO2 symmetry with \(D_{\infty h}\) CO2 has a total of four of stretching and bending modes but only two are seen. Two of its bands are degenerate and one of the vibration modes is symmetric hence it does not cause a dipole moment change because the polar directions cancel each other. The vibrational modes are illustrated below:
The Deduction of Frequency
The second law of Newton states that
\[F = ma\label{7}\]
where m is the mass and a is the acceleration, acceleration is a 2nd order differential equation of distance with respect to time. Thus "a" can be written as
\[a = \dfrac{d^2 y}{d t} \label{8}\]
Substituting this into Equation \ref{1} gives
\[\dfrac{m d^2 y}{d t^2}= - k y \label{9}\]
the 2nd order differential equation of this equation is equal to \(\dfrac{-k}{m}\) displacement of mass and time can be stated as
\[y = A\cos 2 \pi \nu_m t \label{10}\]
where vm is the natural vibrational frequency and A is the maximum amplitude of the motion. On differentiating a second time the equation becomes
\(\dfrac{d^2 y}{d t^2} = - 4 \pi^2 \nu_m^2 A \cos 2 \pi \nu_m t \label{11}\)
substituting the two equations above into Newton's second law for a harmonic oscillator,
\[m*\left (-4\pi^{2}\nu_{m}^{2} A \textrm{cos }2\pi\nu_{m}t \right ) = -k * \left ( A\textrm{cos }2\pi\nu_{m}t \right ) \label{12}\]
If we cancel out the two functions \(y\),
\[4m\pi^{2}\nu_{m}^{2} = k \]
from above, we obtain the natural frequency of the oscillation.
\[\nu_m = \dfrac{1}{2\pi} \sqrt{\dfrac{k}{m}} \label{13}\]
\(\nu_m\) which is the natural frequency of the mechanical oscillator which depends on the force constant of the spring and the mass of the attached body and independent of energy imparted on the system. when there are two masses involved in the system then the mass used in the above equation becomes
\[\mu = \dfrac{m_1 m_2}{m_1+m_2} \label{14}\]
The vibrational frequency can be rewritten as
\[\nu_m = \dfrac{1}{2\pi} \sqrt{\dfrac{k}{\mu}} \label{15}\]
The Deduction of Wave Number
Using the harmonic oscillator and wave equations of quantum mechanics, the energy can be written as
\[E = \left(v+\dfrac{1}{2}\right) \dfrac{h}{2\pi} \sqrt{\dfrac{k}{\mu}} \label{16}\]
where h is Planck's constant and v is the vibrational quantum number and ranges from 0,1,2,3.... infinity.
\[E = \left(v+\dfrac{1}{2}\right)hv_m \label{17}\]
where \(\nu_m\) is the vibrational frequency. Transitions in vibrational energy levels can be brought about by absorption of radiation, provided the energy of the radiation exactly matches the difference in energy levels between the vibrational quantum states and provided the vibration causes a change in dipole moment. This can be expressed as
\[{\triangle E} = hv_m = \dfrac{h}{2\pi} \sqrt{\dfrac{k}{\mu}} \label{18}\]
At room temperature, the majority of molecules are in the ground state v = 0, from the equation above
\[E_o = \dfrac{1}{2}hv_m \label{19}\]
following the selection rule, when a molecule absorbs energy, there is a promotion to the first excited state
\[E_1 = \dfrac{3}{2} hv_m \label{20}\]
\[\left(\dfrac{3}{2} hv_m - \dfrac{1}{2} hv_m \right) = hv_m \label{21}\]
The frequency of radiation v that will bring about this change is identical to the classical vibrational frequency of the bond vm and it can be expressed as
\[E_{radiation} = hv = {\triangle E} = hv_m = \dfrac{h}{2\pi} \sqrt{\dfrac{k}{\mu}} \label{22}\]
The above equation can be modified so that the radiation can be expressed in wave numbers
\[\widetilde{\nu} = \dfrac{h}{2\pi c} \sqrt{\dfrac{k}{\mu}} \label{23}\]
where
- \(c\) is the velocity of light (cm s-1) and
- \(\widetilde{\nu}\) is the wave number of an absorption maximum (cm-1)
Theory of IR
Molecular vibrational frequencies lie in the IR region of the electromagnetic spectrum, and they can be measured using the IR technique. In IR, polychromatic light (light having different frequencies) is passed through a sample and the intensity of the transmitted light is measured at each frequency. When molecules absorb IR radiation, transitions occur from a ground vibrational state to an excited vibrational state (Figure 1).
For a molecule to be IR active there must be a change in dipole moment as a result of the vibration that occurs when IR radiation is absorbed. Dipole moment is a vector quantity and depends on the orientation of the molecule and the photon electric vector. The dipole moment changes as the bond expands and contracts. When all molecules are aligned as in a crystal and the photon vector points along a molecular axis such as z. Absorption occurs for the vibrations that displace the dipole along z. Vibrations that are totally x or y polarized would be absent. Dipole moment in a heteronuclear diatomic molecule can be described as uneven distribution of electron density between the atoms. One atom is more electronegative than the other and has a net negative charge.
The dipole moment can be expressed mathematically as
\(\mu = er \label{24}\)
The relationship between IR intensity and dipole moment is given as
\(I_{IR} \propto \left(\dfrac{d\mu}{dQ}\right)^2 \label{25}\)
relating this to intensity of the IR radiation, we have have the following equation below.
where \(\mu\) is the dipole moment and \(Q\) is the vibrational coordinate. The transition moment integral, that gives information about the probability of a transition occurring, for IR can also be written as
\(\langle \psi_ | \hat{M}| \psi_f \rangle \label{26}\)
\(i\) and \(f\) represent are initial and final states. \(\psi_i\) is the wave function. Relating this to IR intensity we have
\(I_{IR} \propto \langle \psi_ | \hat{M}| \psi_f \rangle \label{27}\)
where \(\hat{M}\) is the dipole moment and has the Cartesian coordinates, \(\hat {M_x}\),\(\hat {M_y}\), \(\hat{M_z}\). In order for a transition to occur by dipole selection rules , at least one of the integrals must be non zero.
Region of IR
The IR region of the electromagnetic spectrum ranges in wavelength from 2 -15 µm. Conventionally the IR region is subdivided into three regions, near IR, mid IR and far IR. Most of the IR used originates from the mid IR region. The table below indicates the IR spectral regions
| Region | Wavelength | Wavenumbers (V), cm-1 | Frequencies (v), HZ |
|---|---|---|---|
| Near | 0.78 -2.5 | 12800 - 4000 | 3.8 x 10¹⁴ - 1.2 x 10¹⁴ |
| Middle | 2.5 - 50 | 4000 - 200 | 3.8 x 10¹⁴ - 1.2 x 10¹⁴ |
| Far | 50 -100 | 200 -10 | 3.8 x 10¹⁴ - 1.2 x 10¹⁴ |
| Most Used | 2.5 -15 | 4000 -670 | 3.8 x 10¹⁴ - 1.2 x 10¹⁴ |
IR deals with the interaction between a molecule and radiation from the electromagnetic region ranging (4000- 40 cm-1). The cm-1 is the wave number scale and it can also be defined as 1/wavelength in cm. A linear wavenumber is often used due to its direct relationship with both frequency and energy. The frequency of the absorbed radiation causes the molecular vibrational frequency for the absorption process. The relationship is given below
\[\bar{v}(cm^{-1}) = \dfrac{1}{\lambda(\mu m)} \times 10^4 (\dfrac{\mu m}{cm}) = \dfrac{v(Hz)}{c(cm/s)} \label{28}\]
- Near InfraRed Spectroscopy: Absorption bands in the near infrared (NIR) region (750 - 2500 nm) are weak because they arise from vibrational overtones and combination bands. Combination bands occur when two molecular vibrations are excited simultaneously. The intensity of overtone bands reduces by one order of overtone for each successive overtone. When a molecule is excited from the ground vibrational state to a higher vibrational state and the vibrational quantum number v is greater than or equal to 2 then an overtone absorption results. The first overtone results from v = 0 to v = 2. The second overtone occurs when v =0 transitions to v = 3. Transitions arising from the near ir absorption are weak, hence they are referred to as forbidden transitions but these transitions are relevant when non-destructive measurements are required such as a solid sample. Near IR spectra though have low absorption they have a high signal to noise ratio owing to intense radiation sources and NIR is able to penetrate undiluted samples and use longer path lengths; it becomes very useful for rapid measurement of more representative samples.
- Far InfraRed Spectroscopy: The far IR region is particularly useful for inorganic studies due to stretching and bending vibrations of bonds between the metal atoms and ligands. The frequencies, which these vibrations are observed, are usually lower than 650 cm-1. Pure rotational absorption of gases is observed in the far IR region when there is a permanent dipole moment present. Examples include H2O, O3, HCl.
IR Analysis
Qualitative Analysis
IR spectroscopy is a great method for identification of compounds, especially for identification of functional groups. Therefore, we can use group frequencies for structural analysis. Group frequencies are vibrations that are associated with certain functional groups. It is possible to identify a functional group of a molecule by comparing its vibrational frequency on an IR spectrum to an IR stored data bank.
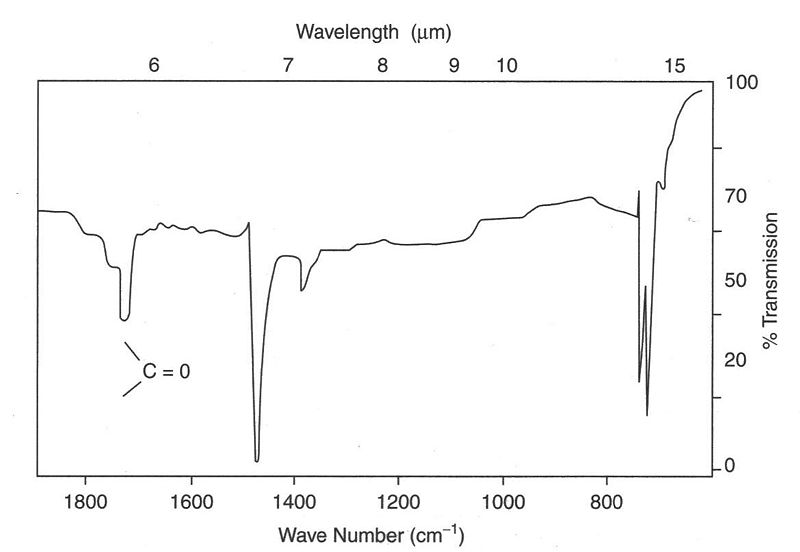
Here, we take the IR spectrum of Formaldehyde for an example. Formaldehyde has a C=O functional group and C-H bond. The value obtained from the following graph can be compared to those in reference data banks stored for Formaldehyde. A molecule with a C=O stretch has an IR band which is usually found near 1700 cm-1 and around 1400 cm-1 for CH2 bend. It's important to note that this value is dependent on other functional groups present on the molecule. The higher 1700 cm-1 indicates a large dipole moment change. It is easier to bend a molecule than stretch it, hence stretching vibrations have higher frequencies and require higher energies than bending modes. The finger print region is a region from 1400-650 cm-1. Each molecule has it's own characteristic print and is often cumbersome to attach any values to this region.
Quantitative Analysis
Infrared spectroscopy can also be applied in the field of quantitative analysis, although sometimes it's not as accurate as other analytical methods, like gas chromatography and liquid chromatography. The main theory of IR quantification is Beer's law or Beer-Lambert law, which is written as
\[ A= \log \left ( \dfrac{I_0}{I} \right ) =\epsilon lc \label{29}\]
Where A is the absorbance of the sample, I is the intensity of transmitted light, I0 is the intensity of incident light, l is the path length, a is the molar absorptivity of the substance, and c is the concentration of the substance.
From the Beer's Law, we could figure out the relation between the absorbance and the concentration of the sample since the analytes have a particular molar absorptivity at a particular wavelength. Therefore, we could use IR spectroscopy and Beer's Law to find the concentration of substance or the components of mixture. This is how the IR quantification operated.
Selection Rules of IR
In order for vibrational transitions to occur, they are normally governed by some rules referred to as selection rules.
- An interaction must occur between the oscillating field of the electromagnetic radiation and the vibrational molecule for a transition to occur. This can be expressed mathematically as
\(\left(\dfrac{d\mu}{dr}\right)_{r_{eq}} \not= 0 \label{30}\)
\(\triangle v = +1\) and \(\triangle J = +1 \label{31}\)
- This holds for a harmonic oscillator because the vibrational levels are equally spaced and that accounts for the single peak observed in any given molecular vibration. For gases J changes +1 for the R branch and -1 for the P branch.\(\triangle J = 0\) is a forbidden transition and hence a q branch for a diatomic will not be present. For any anharmonic oscillator, the selection rule is not followed and it follows that the change in energy becomes smaller. This results in weaker transitions called overtones, then \(\triangle v = +2\) (first overtone) can occur, as well as the 2nd overtone \(\triangle v = +3\). The frequencies of the 1st and 2nd overtones provides information about the potential surface and about two to three times that of the fundamental frequency.
- For a diatomic, since \(\mu\) is known, measurement of ue provides a value for k, the force constant.
\(k = \left(\dfrac{d^2 V(r)}{dr^2}\right)_{r_{eq}} \label{32}\)
where k is the force constant and indicates the strength of a bond.
Influence Factors of IR
- Isotope Effects: It's been observed that the effect on k when an atom is replaced by an isotope is negligible but it does have an effect on \(\nu\) due to changes in the new mass. This is because the reduced mass has an effect on the rotational and vibrational behavior.
- Solvent Effects: The polarity of solvent will have an influence on the IR spectra of organic compounds due to the interactions between solvent and compounds, which is called solvent effects. If we place a compound, which contains n, pi and pi* orbitals, into a polar solvent, the solvent will stabilizes these three orbitals in different extent. The stabilization effects of polar solvent on n orbital is the largest one, the next larger one is pi* orbital, and the effects on pi orbital is the smallest one. The spectra of n→pi* transition will shift to blue side, which means it will move to shorter wavelengths and higher energies since the polar solvent causes the energy difference between n orbital and pi* orbital to become bigger. The spectra of pi→pi* transition will shift to red side, which means it will move to longer wavelengths and lower energies since the polar solvent causes the energy difference between n orbital and pi* orbital to become smaller.
Advantages of IR
- High Scan Speed: Infrared spectroscopy can get information for the whole range of frequency simultaneously, within one second. Therefore, IR can be used to analyze a substance that is not very stable and finish the scan before it start to decompose.
- High Resolution: The resolution of general prism spectrometer is only about 3 cm-1, but the resolution of infrared spectrometer is much higher. For example, the resolution of Grating infrared spectrometer could be 0.2 cm-1, the resolution of FT infrared spectrometer could be 0.1-0.005 cm-1.
- High Sensitivity: With Fourier Transform, the infrared spectrometer doesn't need to use the slit and monochromator. In this way, the reflection specularity will be increased and the loss of energy in the analysis process will be decreased. Therefore the energy that reaches the detector is large enough and even very small amount of analytes could be detected. Nowadays, the infrared spectroscopy could detect the sample as small as 1-10 grams.
- Wide Range of Application: Infrared spectroscopy could be used to analyze almost all organic compounds and some inorganic compounds. It has a wide range of application in both qualitative analysis and quantitative analysis. Also, the sample of Infrared spectroscopy doesn't have phase constraints. It could be gas, liquid or solid, which has enlarged the range of analytes a lot.
- Large Amount of Information: Infrared Spectra could give us lots of structural information of the analytes, such as the type of compound, the functional group of compound, the stereoscopic structure of compound, the number and position of substituent group and so on. Depending on the available information form the functional part and the fingerprint part, infrared spectroscopy has become a great method to identify different kinds of compounds.
- Non-Destructive: Infrared Spectroscopy is non-destructive to the sample.
Disadvantages of IR
- Sample Constraint: Infrared spectroscopy is not applicable to the sample that contains water since this solvent strongly absorb IR light.
- Spectrum Complication: The IR spectrum is very complicated and the interpretation depends on lots of experience. Sometimes, we cannot definitely clarify the structure of the compound just based on one single IR spectrum. Other spectroscopy methods, such as ( Mass Spectrometry) MS and ( Nuclear Magnetic Resonance) NMR, are still needed to further interpret the specific structure.
- Quantification: Infrared spectroscopy works well for the qualitative analysis of a large variety of samples, but quantitative analysis may be limited under certain conditions such as very high and low concentrations.
Symmetry & IR Spectroscopy
One of the most importance applications of IR spectroscopy is structural assignment of the molecule depending on the relationship between the molecule and observed IR absorption bands. Every molecule is corresponding to one particular symmetry point group. Then we can predict which point group the molecule is belonging to if we know its IR vibrational bands. Vice versa, we can also find out the IR active bands from the spectrum of the molecule if we know its symmetry. These are two main applications of group theory. We'll take the following problem as an example to illustrate how this works.
Question
How do you distinguish whether the structure of transition metal complex molecule M(CO)2L4 is cis or trans by inspection of the CO stretching region of the IR spectra?
Answer
For cis-M(CO)2L4, the symmetry point group of this molecule is C2v.
| C2v | E | C2 | \({\sigma}\)(xz) | \({\sigma}\)(yz) |
| \({\gamma}\)co | 2 | 0 | 2 | 0 |
\({\gamma}\)co = A1 + B1
Since A1 has a basis on z axis and B1 has a basis on x axis, there are two IR vibrational bands observed in the spectrum.
For trans-M(CO)2L4, the symmetry point group of this molecule is D4h.
| D4h | E | C4 | C2 | C2' | C2" | i | S4 | \({\sigma_h}\) | \({\sigma_v}\) | \({\sigma_d}\) |
| \({\gamma}\)co | 2 | 2 | 2 | 0 | 0 | 0 | 0 | 0 | 2 | 2 |
\({\gamma}\)co = A1g + A2u
Since A2u has a basis on z axis, there is only one IR vibrational band observed in the spectrum.
Therefore, from what have been discussed above, we can distinguish these two structures based on the number of IR bands.
Problems
The frequency of C=O stretching is higher than that of C=C stretching. The Intensity of C=O stretching is stronger than that of C=C stretching. Explain it.
References
- D. A. Skoog, F. J. Holler, S. R. Crouch. Principles of Instrumental Analysis, 6th ed. Belmont, CA. Thomson Higher Education. 2007
- G. D. Christain. Analytical Chemistry, 5th ed. New York. John Wiley & Sons, INC. 1994
- R. S. Drago. Physical Methods, 2nd ed. Mexico.Saunders College Publishing.1992
- S.M. Blinder. Introduction to Quantum Mechanics. Academic Press. 2004
- D. C. Harris, M. D. Bertolucci. Symmetry and Spectroscopy: An Introduction to Vibrational and Electronic Spectroscopy. New York. Dover Publications, INC
Contributors and Attributions
- Richard Osibanjo, Rachael Curtis, Zijuan Lai