
4.28: A Sum Over Histories Approach to Fourier Transform Infrared Spectroscopy
- Page ID
- 151317

A Michelson interferometer with a movable mirror in one arm is an essential element in a Fourier transform infrared (FTIR) spectrophotometer. Feynman's "sum over histories" approach to quantum mechanics will be used to analyze its operation. The analysis is similar to that used for the Mach-Zehnder interferometer in Chapter 6.
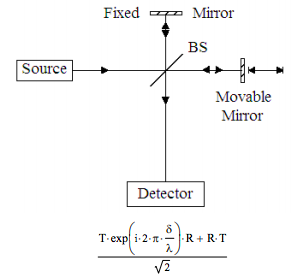
There are two photon paths (histories) to the detector from the source. The photon can be transmitted by the beam splitter into the arm with the movable mirror, returned to the beam splitter by the mirror, and then reflected at the beam splitter to the detector. And it can be reflected at the beam splitter into the arm with the fixed mirror, returned to the beam splitter, and then transmitted to the detector. The probability amplitudes for transmission and reflection at the beam splitter are given below, along with the phase shift that occurs due to any path difference in the arms of the interferometer.
Probability amplitude for photon transmission at a 50-50 beam splitter: \( \langle T|S \rangle = \frac{1}{ \sqrt{2}} \)
Probability amplitude for photon reflection at a 50-50 beam splitter: \( \langle R|S \rangle = \frac{i}{ \sqrt{2}} \)
Phase shift due to the path difference between the beam splitter arms: \( \text{exp} \left( i 2 \pi \frac{ \delta}{ \lambda} \right)\)
The probability amplitude for photon detection is given below the figure. Using the information above yields the following expression.
\[ \frac{1}{ \sqrt{2}} \text{exp} \left( i 2 \pi \frac{ \delta}{ \lambda} \right) \frac{i}{ \sqrt{2}} + \frac{i}{ \sqrt{2}} \frac{1}{ \sqrt{2}} \nonumber \]
The probability the photon will arrive at the detector is the magnitude squared of the probability amplitude.
\[ \left( \left| \frac{1}{ \sqrt{2}} \text{exp} \left( i 2 \pi \frac{ \delta}{ \lambda} \right) \frac{i}{ \sqrt{2}} + \frac{i}{ \sqrt{2}} \frac{1}{ \sqrt{2}} \right| \right)^2 \text{ simplify } \rightarrow \frac{1}{2} \cos \left( 2 \pi \frac{ \delta}{ \lambda} \right) + \frac{1}{2} \nonumber \]
For a single wavelength source the intensity at the detector as a function of δ traces a cosine.
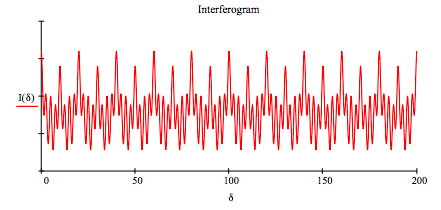
In FTIR spectroscopy the source is a "glower" that emits a broad range of infrared frequencies. In this case the signal at the detector is the sum of of intensities of the individual photons. This is called an interferogram and has the following mathematical form.
\[ I ( \delta) = \sum_j \left( \frac{1}{2} \cos \left( 2 \pi \frac{ \delta}{ \textcolor{red}{ \lambda_j }} \right) + \frac{1}{2} \right) \nonumber \]
The interferogram is obtained by measuring the intensity at the detector as a function of the path difference (δ) also called the retardation. In the next step the intensity of the frequencies present in the source beam are recovered by the following Fourier transform. The mirror moves at a constant speed, so δ is proportional to time. Therefore, this is a time-frequency Fourier transform.
\[ B( \nu) = \int I ( \delta) \text{exp} (i 2 \pi \delta \nu ) d \delta \nonumber \]
To illustrate the FT method we will assume that the source beam only contains four wavelengths or frequencies.
\[ \begin{matrix} \text{Wavelengths:} & \lambda_1 = 20 & \lambda_2 = 10 & \lambda_3 = 5 & \lambda_4 = 2.5 \\ \text{Intensities:} & B_1 = 3 & B_2 = 5 & B_3 = 4 & B_4 = 6 \\ \text{Frequencies:} & \frac{1}{ \lambda_1} = 0.05 & \frac{1}{ \lambda_2} = 0.1 & \frac{1}{ \lambda_3} = 0.2 & \frac{1}{ \lambda_4} = 0.4 \end{matrix} \nonumber \]
Generate interferogram:
\[ \begin{matrix} I ( \delta) = & \frac{1}{2} \left( \cos \left( 2 \pi \frac{ \delta}{ \lambda_1} \right) +1 \right) B_1 + \frac{1}{2} \left( \cos \left( 2\pi \frac{ \delta}{ \lambda_2} \right) + 1 \right) B_2 ... \\ & + \frac{1}{2} \left( \cos \left( 2 \pi \frac{ \delta}{ \lambda_3} \right) +1 \right) B_3 + \frac{1}{2} \left( \cos \left( 2 \pi \frac{ \delta}{ \lambda_4} \right) +1 \right) B_4 \end{matrix} \nonumber \]
Display interferogram:
\[ \delta = 0, .1 .. 200 \nonumber \]
Fourier transform interferogram to recover frequencies and intensities:
\[ \begin{matrix} B ( \nu ) = \int_0^{200} I ( \delta) \text{exp} (i 2 \pi \delta \nu) d \delta & \nu = 0, .005 .. 5 \end{matrix} \nonumber \]
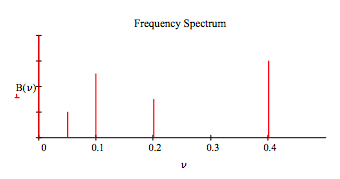
This calculation reveals how a Michelson interferometer is used to measure the wavelengths or frequencies present in the source beam. In a FT‐IR instrument the source ideally contains all the IR frequencies. The sample is placed between the beam splitter and the detector and an absorption spectrum is measured.