
2.4: How do I choose the right acquisition parameters for a quantitative NMR measurement?
- Page ID
- 77775

This may not be a big consideration in measuring a UV-visible or IR spectrum; you generally just walk up to the instrument, place your sample in a sample holder and make a measurement. However, with NMR there are several parameters, summarized below, that can have a huge impact on the quality of your results and whether or not your results can be interpreted quantitatively.
Number of Scans
An important consideration is the number of FIDs that are coadded. Especially for quantitative measurements it is important to generate spectra that have a high signal-to-noise ratio to improve the precision of the determination. Because the primary noise source in NMR is thermal noise in the detection circuits, the signal-to-noise ratio (S/N) scales as the square root of the number of scans coadded. To be 99% certain that the measured integral falls within + 1% of the true value, a signal-to-noise ratio of 250 is required. Acquisition of high quality spectra for dilute solutions can be very time consuming. However, even when solutions have a sufficiently high concentration that signal averaging is not necessary to improve the S/N, a minimum number of FIDs (typically 8) are coadded to reduce spectral artifacts arising from pulse imperfections or receiver mismatch.
A solution prepared for quantitative analysis using NMR was acquired by coaddition of 8 FIDs produces a spectrum with an S/N of 62.5 for the analyte signals. How many FIDs would have to be coadded to produce a spectrum with an S/N of 250?
Acquisition Time
The acquisition time (AT) is the time after the pulse for which the signal is detected. Because the FID is a decaying signal, there is not much point in acquiring the FID for longer than 3 x T2 because at that point 95% of the signal will have decayed away into noise. Typical acquisition times in 1H NMR experiments are 1 – 5 sec.
An interesting feature in choosing an acquisition time is the relationship between the number of data points collected and the spectral width, or the range of frequencies detected. Although the initial FID detected in the coil is an analog signal, it needs to be digitized for computer storage and Fourier transformation. According to Nyquist theory, the minimum sampling frequency is at least twice the highest frequency detected. The dwell time (DW) or time between data point sampling is a parameter that is not typically set by the user, but determined by the spectral width (SW) and the number of data points (NP).
\[DW = \dfrac{1}{2SW} \label{E4}\]
\[AT = DW × NP \label{E5}\]
Another feature of the acquisition parameters that is important for quantitative measurements is the digital resolution (DR).
\[DR = \dfrac{SW}{NP(real)} \label{E6}\]
Almost all spectrometers are designed with quadrature phase detection, which in effect splits the data points into real and imaginary datasets that serve as inputs for a complex Fourier transform. It is important to have sufficient digital resolution to accurately define the peak. Since a typical 1H NMR resonance has a width at half height (w1/2) of 0.5 to 1.0 Hz, 8-10 data points are required to accurately define the peak. The total number of data points used in the Fourier transformation and contributing to the digital resolution can be increased by zero-filling, as described in the section on data processing.
A 1H NMR spectrum was measured using a 400 MHz instrument by acquisition of 16,384 total data points (8192 real points) and a spectral width of 12 ppm. What was the acquisition time? Calculate the digital resolution of the resulting spectrum? Is this digital resolution sufficient to accurately define a peak with a width at half height of 0.5 Hz?
Receiver Gain
The receiver includes the coil and amplifier circuitry that detects and amplifies the signal prior to digitization by the analog-to-digital converter (ADC). It is important to set the receiver gain properly so that the ADC is mostly filled, without overflowing. ADC’s used in NMR typically have limited dynamic range of 16 -18 bits. If the receiver gain is set too low, only a few bits of the ADC are filled and digitization error can contribute to poor S/N. If the receiver gain is set too high, (called clipping the FID) the initial portions of the FID will overflow the ADC and will not be properly digitized. In this case, resonance intensity can no longer be interpreted in a quantitative manner. In addition, a lot of spurious signals will appear in the spectrum. For most experiments the autogain routine supplied by the NMR manufacturer will work well for the initial setup of the experiment.
Repetition Time
The repetition time is the total time between the start of acquisition of the first FID and the start of acquisition of the second FID. The repetition time is the sum of the acquisition time and any additional relaxation delay inserted prior to the rf pulse. Recall that there are two relaxation times in NMR, T1 and T2 (with T1 ≥ T2). If a pulse width of 90o is used to signal average multiple FIDs to improve S/N or reduce artifacts, we generally need to wait 5 x T1 between each acquisition so that the magnetization can relax essentially completely (by at least 99%) to its equilibrium state. If the repetition time is less than 5T1, the resonances in the spectrum cannot be simply interpreted in a quantitative manner and resonance intensity is scaled according to T1.
The inversion-recovery pulse sequence can be used to measure T1 relaxation times. In this pulse sequence, diagrammed below, the magnetization is inverted by a 180o pulse. The relaxation delay at the start of the experiment is selected to assure complete relaxation between acquisitions.
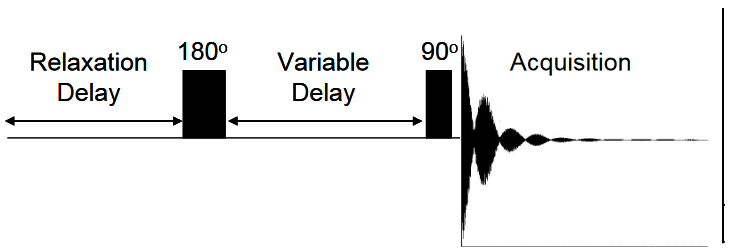
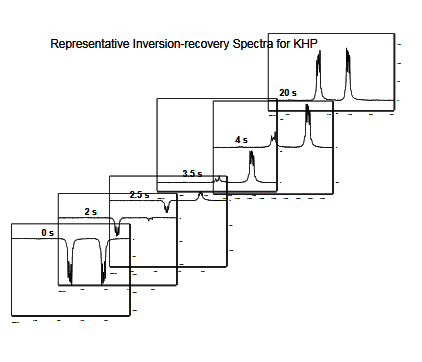
During the variable delay, magnetization relaxes by spin-lattice (T1) relaxation and is tipped into the transverse plane by the 90o read pulse. The intensity of the resonances is measured and then fit to an exponential function to determine the T1 relaxation time. The figure below shows selected spectra measured for the KHP protons using the inversion-recovery experiment and the fit of the integral of one of the resonances to determine the T1 relaxation time of the corresponding proton.

Pulse Width
As described in the Basic Theory section, the NMR signal is detected as a result of a radio frequency (rf) pulse that excites the nuclei in the sample. The pulse width is a calibrated parameter for each instrument and sample that is typically expressed in µs. The pulse width can also be thought of in terms of the tip angle, θ, of the pulse
\[\mathrm{θ = γB_1τ} \label{E7}\]
where γ is the gyromagnetic ratio, B1 is the strength of the magnetic field produced by the pulse and \(τ\) is the length of the pulse. For quantitative NMR spectra, 90o pulses with a repetition time ≥ 5T1 are typically used since this pulse produces the greatest S/N in a single scan, although other pulse widths can also be used. For spectra where qualitative, rather than quantitative analysis is desired, significant time savings can be obtained by using shorter pulses (i.e. 30o ) since the magnetization takes less time to recover to its equilibrium state after the pulse. For a more detailed analysis of the effects of tip angle in quantitative NMR experiments, visit the following page.