
9.9.9C: Atomic Sizes and Electron Density Distributions
- Page ID
- 64786

Knowledge of the relative sizes of atoms is important because their chemistry often correlates with size. For example, substituting one element for another in a crystal to modify the properties of the crystal often works if the two elements have essentially the same atomic size. Understanding electron density distributions is also important in understanding chemical properties.
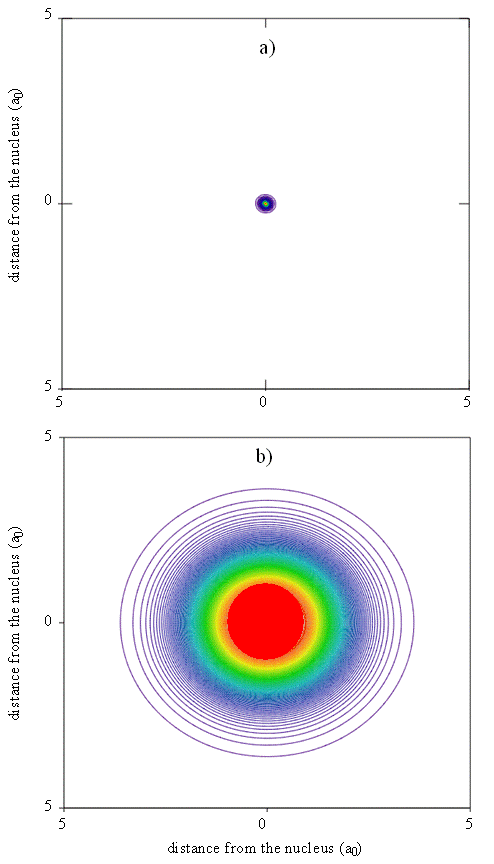
An approximate but reasonably accurate theoretical understanding of electron density patterns in multi-electron atoms can be built from an examination of the individual atomic orbitals. Thus, for the neon atom, for example, we can create a map of total electron density that can be used to produce pictures like the one shown in Figure \(\PageIndex{8}\), where colored contours represent different probability density isosurfaces. We create such a map by superimposing the contributions to the electron probability density that arise from each of the spin-orbitals used to construct the multi-electron wavefunction. Maps like this help us to understand the meaning of the size or spatial extent of an atom or molecule and are particularly useful when the degree of diffuseness of electron density needs to be understood. Electron diffraction experiments produce similar maps that can be compared to the theoretical results.
Although the size of an atom is not precisely defined because the positions of the electrons are given by probability density functions, various criteria have been proposed for characterizing atomic sizes. An empirical criterion, which originally was used by Pauling, is to take the atomic radius as half the bond length in a diatomic molecule of the element, e.g. C2 for carbon. This distance is called the covalent radius. It also can be determined indirectly by measuring the bond length for an atom of known covalent radius and subtracting this value from the bond length. X-ray crystallography and gas-phase microwave spectroscopy (rotational spectra) are powerful methods for providing such data.
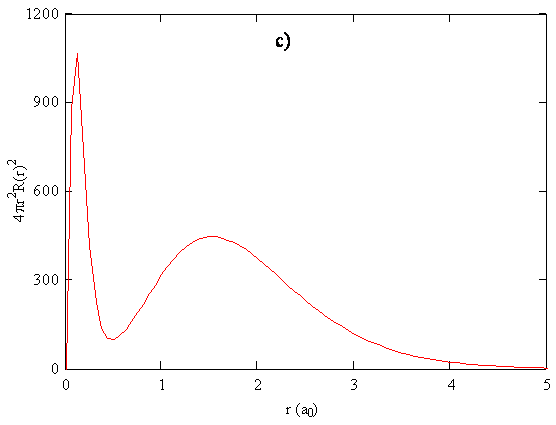
Since the radial functions we obtain for the wavefunctions show electron density decaying exponentially with distance from the nucleus, there is no obvious end to an atom. To relate calculated probability densities to trends in atomic size, it is necessary to choose a cutoff point that can be applied consistently for different atoms. Various methods for doing so include drawing an edge for the atom so that a certain percentage, typically 95%, of the electron density is enclosed. Alternatively, the outside of the atom can be given by an isosurface of some specified total electron probability density. Another criterion that we could use to define the size is the position of the maximum in the radial function or the radial distribution function for the outermost electron. The outermost electron for a particular atom can be defined as the electron that has its maximum in the radial distribution function at the largest value of r.
The major periodic trends in the experimentally-measured atomic radii found in Figure \(\PageIndex{1}\) at the beginning of the chapter can be modeled with varying degrees of accuracy using the Hartree-Fock wavefunctions with any of the methods described above.
Exercise \(\PageIndex{1C}\)
Predict the relative sizes of Li, Be, B, Al, Ca, Sr and Rh.