2.2: Charles' Law
- Page ID
- 151822
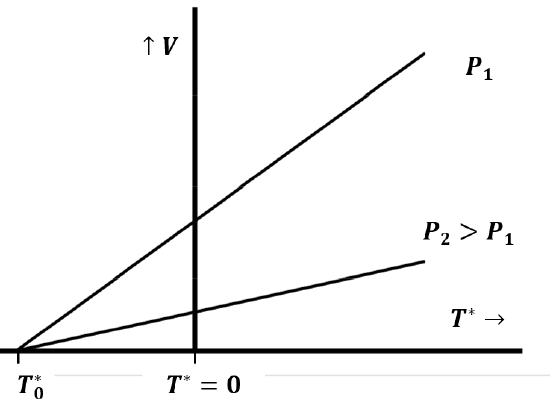
Quantitative experiments establishing the law were first published in 1802 by Gay-Lussac, who credited Jacques Charles with having discovered the law earlier. Charles’ law relates the volume and temperature of a gas when measurements are made at constant pressure. We can imagine rediscovering Charles’ law by trapping a sample of gas in a tube and measuring its volume as we change the temperature, while keeping the pressure constant. This presumes that we have a way to measure temperature, perhaps by defining it in terms of the volume of a fixed quantity of some other fluid—like liquid mercury. At a fixed pressure, \(P_1\), we observe a linear relationship between the volume of a sample of gas and its temperature, like that in Figure 2. If we repeat this experiment with the same gas sample at a higher pressure, \(P_2\), we observe a second linear relationship between the volume and the temperature of the gas. If we extend these lines to their intersection with the temperature axis at zero volume, we make a further important discovery: Both lines intersect the temperature axis at the same point.

We can represent this behavior mathematically as
\[V={\beta }^*\left(n,P\right)T^*+{\gamma }^*(n,P) \nonumber \]
where we recognize that both the slope and the V-axis intercept of the graph depend on the pressure of the gas and on the number of moles of gas in the sample. A little reflection shows that here too the slope and intercept must be directly proportional to the number of moles of gas, so that we can rewrite our equation as
\[V=n\beta \left(P\right)T^*+n\gamma (P) \nonumber \]
When we repeat these experiments with different gaseous substances, we discover an additional important fact: \(\beta (P)\) and \(\gamma (P)\) are the same for any gas. This means that the temperature at which the volume extrapolates to zero is the same for any gas and is independent of the constant pressure we maintain as we vary the temperature (Figure 2).


