12.7: Interpreting Infrared Spectra
- Page ID
- 31528
After completing this section, you should be able to
- describe how the so-called “fingerprint region” of an infrared spectrum can assist in the identification of an unknown compound.
- identify the functional group or groups present in a compound, given a list of the most prominent absorptions in the infrared spectrum and a table of characteristic absorption frequencies.
- identify the broad regions of the infrared spectrum in which occur absorptions caused by
- \(\ce{\sf{N-H}}\), \(\ce{\sf{C-H}}\), and \(\ce{\sf{O-H}}\)
- \(\ce{\sf{C#C}}\) and \(\ce{\sf{C#N}}\)
- \(\ce{\sf{C=O}}\), \(\ce{\sf{C=N}}$, and $\ce{\sf{C=C}}\)
Make certain that you can define, and use in context, the key term below.
- fingerprint region
When answering assignment questions, you may use this IR table to find the characteristic infrared absorptions of the various functional groups. However, you should be able to indicate in broad terms where certain characteristic absorptions occur. You can achieve this objective by memorizing the following table.
| Region of Spectrum (cm−1) | Absorption |
|---|---|
| 2500-4000 | $\ce{\sf{N−H}}$, $\ce{\sf{O−H}}$, $\ce{\sf{C−H}}$ |
| 2000-2500 | $\ce{\sf{C#C}}$, $\ce{\sf{C#N}}$ |
| 1500-2000 | $\ce{\sf{C=O}}$, $\ce{\sf{C=N}}$, $\ce{\sf{C=C}}$ |
| below 1500 | Fingerprint region |
The Origin of Group Frequencies
An important observation made by early researchers is that many functional group absorb infrared radiation at about the same wavenumber, regardless of the structure of the rest of the molecule. For example, C-H stretching vibrations usually appear between 3200 and 2800cm-1 and carbonyl(C=O) stretching vibrations usually appear between 1800 and 1600cm-1. This makes these bands diagnostic markers for the presence of a functional group in a sample. These types of infrared bands are called group frequencies because they tell us about the presence or absence of specific functional groups in a sample.
.gif?revision=1&size=bestfit&width=720&height=335)
The region of the infrared spectrum from 1200 to 700 cm-1 is called the fingerprint region. This region is notable for the large number of infrared bands that are found there. Many different vibrations, including C-O, C-C and C-N single bond stretches, C-H bending vibrations, and some bands due to benzene rings are found in this region. The fingerprint region is often the most complex and confusing region to interpret, and is usually the last section of a spectrum to be interpreted. However, the utility of the fingerprint region is that the many bands there provide a fingerprint for a molecule.

The key absorption peak in this spectrum is that from the carbonyl double bond, at 1716 cm-1 (corresponding to a wavelength of 5.86 mm, a frequency of 5.15 x 10¹³ Hz, and a ΔE value of 4.91 kcal/mol). Notice how strong this peak is, relative to the others on the spectrum: a strong peak in the 1650-1750 cm-1 region is a dead giveaway for the presence of a carbonyl group. Within that range, carboxylic acids, esters, ketones, and aldehydes tend to absorb in the shorter wavelength end (1700-1750 cm-1), while conjugated unsaturated ketones and amides tend to absorb on the longer wavelength end (1650-1700 cm-1).
The jagged peak at approximately 2900-3000 cm-1 is characteristic of tetrahedral carbon-hydrogen bonds. This peak is not terribly useful, as just about every organic molecule that you will have occasion to analyze has these bonds. Nevertheless, it can serve as a familiar reference point to orient yourself in a spectrum.
You will notice that there are many additional peaks in this spectrum in the longer-wavelength 400 -1400 cm-1 region. This part of the spectrum is called the fingerprint region. While it is usually very difficult to pick out any specific functional group identifications from this region, it does, nevertheless, contain valuable information. The reason for this is suggested by the name: just like a human fingerprint, the pattern of absorbance peaks in the fingerprint region is unique to every molecule, meaning that the data from an unknown sample can be compared to the IR spectra of known standards in order to make a positive identification. In the mid-1990's, for example, several paintings were identified as forgeries because scientists were able to identify the IR footprint region of red and yellow pigment compounds that would not have been available to the artist who supposedly created the painting (for more details see Chemical and Engineering News, Sept 10, 2007, p. 28).
Now, let’s take a look at the IR spectrum for 1-hexanol.

As you can see, the carbonyl peak is gone, and in its place is a very broad ‘mountain’ centered at about 3400 cm-1. This signal is characteristic of the O-H stretching mode of alcohols, and is a dead giveaway for the presence of an alcohol group. The breadth of this signal is a consequence of hydrogen bonding between molecules.
In the spectrum of octanoic acid we see, as expected, the characteristic carbonyl peak, this time at 1709 cm-1.

We also see a low, broad absorbance band that looks like an alcohol, except that it is displaced slightly to the right (long-wavelength) side of the spectrum, causing it to overlap to some degree with the C-H region. This is the characteristic carboxylic acid O-H single bond stretching absorbance.
The spectrum for 1-octene shows two peaks that are characteristic of alkenes: the one at 1642 cm-1 is due to stretching of the carbon-carbon double bond, and the one at 3079 cm-1 is due to stretching of the s bond between the alkene carbons and their attached hydrogens.

Alkynes have characteristic IR absorbance peaks in the range of 2100-2250 cm-1 due to stretching of the carbon-carbon triple bond, and terminal alkenes can be identified by their absorbance at about 3300 cm-1, due to stretching of the bond between the sp-hybridized carbon and the terminal hydrogen.
It is possible to identify other functional groups such as amines and ethers, but the characteristic peaks for these groups are considerably more subtle and/or variable, and often are overlapped with peaks from the fingerprint region. For this reason, we will limit our discussion here to the most easily recognized functional groups, which are summarized in this table.
As you can imagine, obtaining an IR spectrum for a compound will not allow us to figure out the complete structure of even a simple molecule, unless we happen to have a reference spectrum for comparison. In conjunction with other analytical methods, however, IR spectroscopy can prove to be a very valuable tool, given the information it provides about the presence or absence of key functional groups. IR can also be a quick and convenient way for a chemist to check to see if a reaction has proceeded as planned. If we were to run a reaction in which we wished to convert cyclohexanone to cyclohexanol, for example, a quick comparison of the IR spectra of starting compound and product would tell us if we had successfully converted the ketone group to an alcohol.
More examples of IR spectra
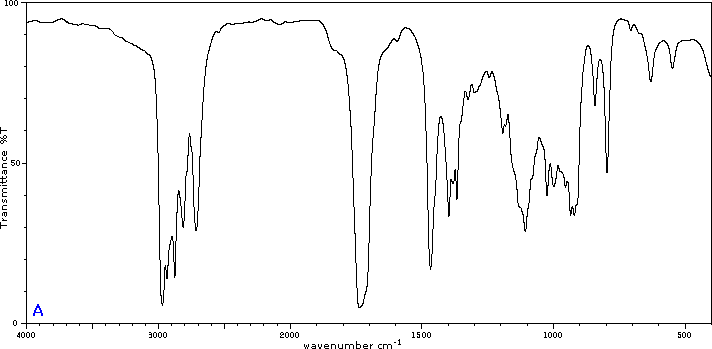
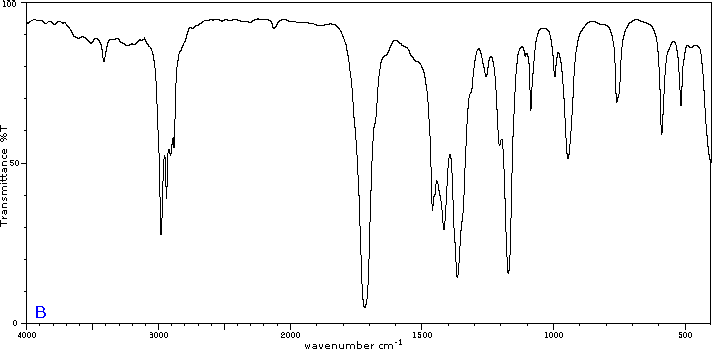
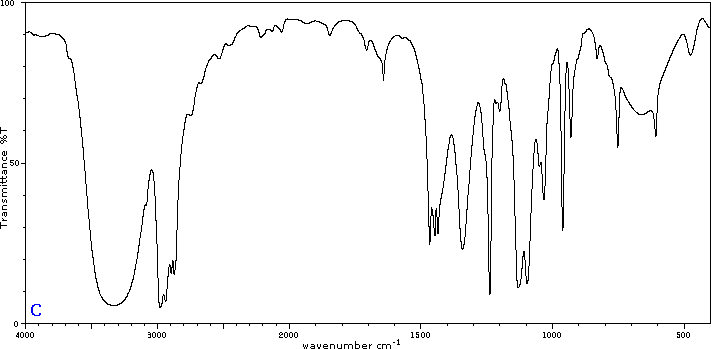
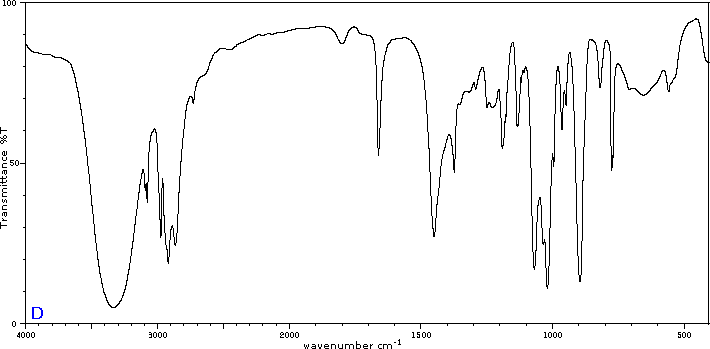
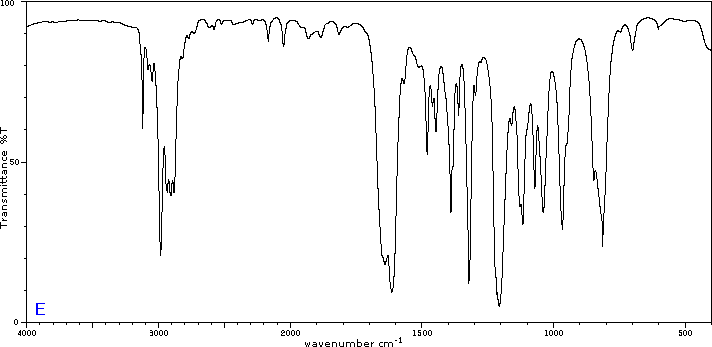
To illustrate the usefulness of infrared absorption spectra, examples for five C4H8O isomers are presented below their corresponding structural formulas. Try to associate each spectrum with one of the isomers in the row above it.

