
22.2: Spectroscopy of Carboxylic Acid Derivatives
- Page ID
- 45934
Infrared Spectroscopy (IR)
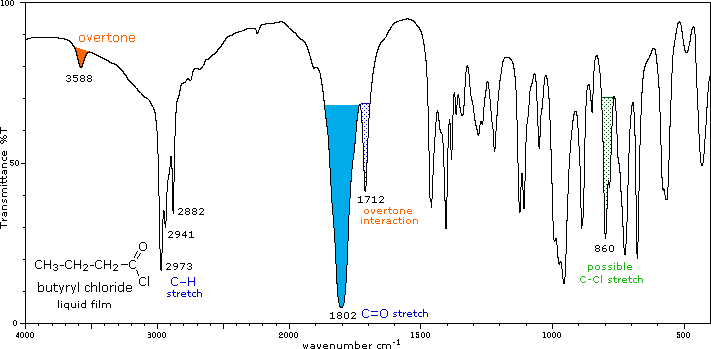
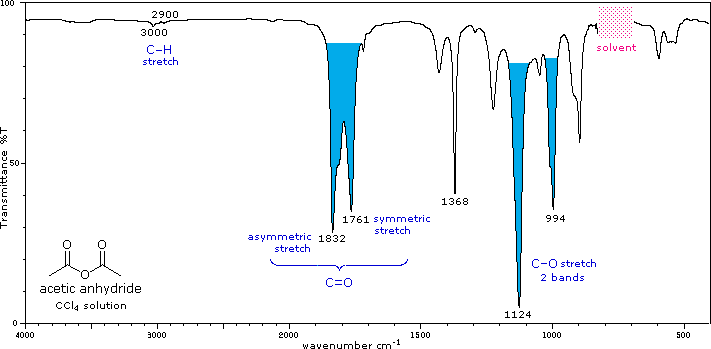
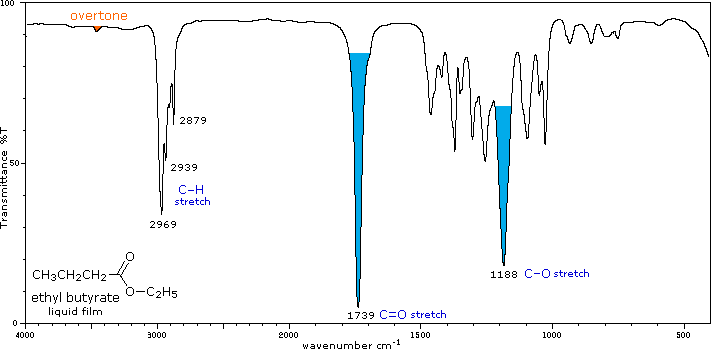
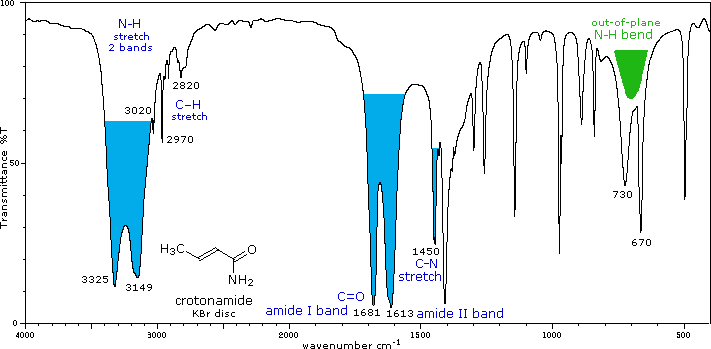
While all of the carboxylic acid derivatives include a carbonyl group, the heteroatoms that characterize the derivative can be used to distinguish between the derivatives. Additionally, there is a useful correlation between the reactivity of the carboxylic acid derivatives and their carbonyl stretching frequencies. Thus, the very reactive acyl halides and anhydrides absorb at frequencies significantly higher, while the relatively unreactive amides absorb at lower frequencies. The IR spectral characteristics that can be used to determine the identity of carboxylic acid derivatives are listed below. Infrared spectra of many carboxylic acid derivatives will be displayed in the figure below the table by clicking the appropriate buttons presented there.
|
Carbonyl Derivative |
Carbonyl Absorption |
Comments |
|---|---|---|
|
Acyl Halides (RCOX) |
C=O stretch |
Conjugation lowers the C=O frequencies reported here, as with aldehydes & ketones. In acyl chlorides a lower intensity shoulder or peak near 1740 cm-1 is due to an overtone interaction. |
|
Acid Anhydride, (RCO)2O |
C=O stretch (2 bands) |
Conjugation lowers the C=O frequencies reported here, as with aldehydes & ketones. The two stretching bands are separated by 60 ± 30 cm-1, and for acyclic anhydrides the higher frequency (asymmetric stretching) band is stronger than the lower frequency (symmetric) absorption. Cyclic anhydrides also display two carbonyl stretching absorptions, but the lower frequency band is the strongest. One or two -CO-O-CO- stretching bands are observed in the 1000 to 1300 cm-1 region. |
|
Esters & Lactones (RCOOR') |
C=O stretch |
Conjugation lowers the C=O frequencies reported here, as with aldehydes & ketones Strong CO-O stretching absorptions (one ot two) are found from 1150 to 1250 cm-1 |
|
Amides & Lactams (RCONR2) |
C=O bands |
The effect of conjugation is much less than for aldehydes & ketones. The higher frequency absorption (1665± 30) is called the Amide I band. The lower frequency Amide II band (1620± 30 in 1° amides & 1530± 30 in 2° amides) is largely due to N-H bending trans to the carbonyl oxygen. In concentrated samples this absorption is often obscured by the stronger amide I absorption. Hydrogen bonded association shifts some of these absorptions, as well as the prominent N-H stretching absorptions. N-H stretch: 3170 to 3500 cm-1. Two bands for 1°-amides, one for 2°-amides. |
NMR Spectra
For NMR, there are a few spectral characteristics that can help identify the carboxylic acid derivative. The protons on carbons adjacent to carbonyls absorb at ~2.0-2.5 ppm. For amides, the N-H protons attached to primary and secondary amines absorb at ~7.5-8.5. For 13C NMR, the carbonyl carbon in carboxylic acid derivatives shows up betweem ~ 160-180 ppm with the carbon in a nitrile appearing ~ 115-120 ppm in their 13C NMR because of its sp hybridization.
Exercise
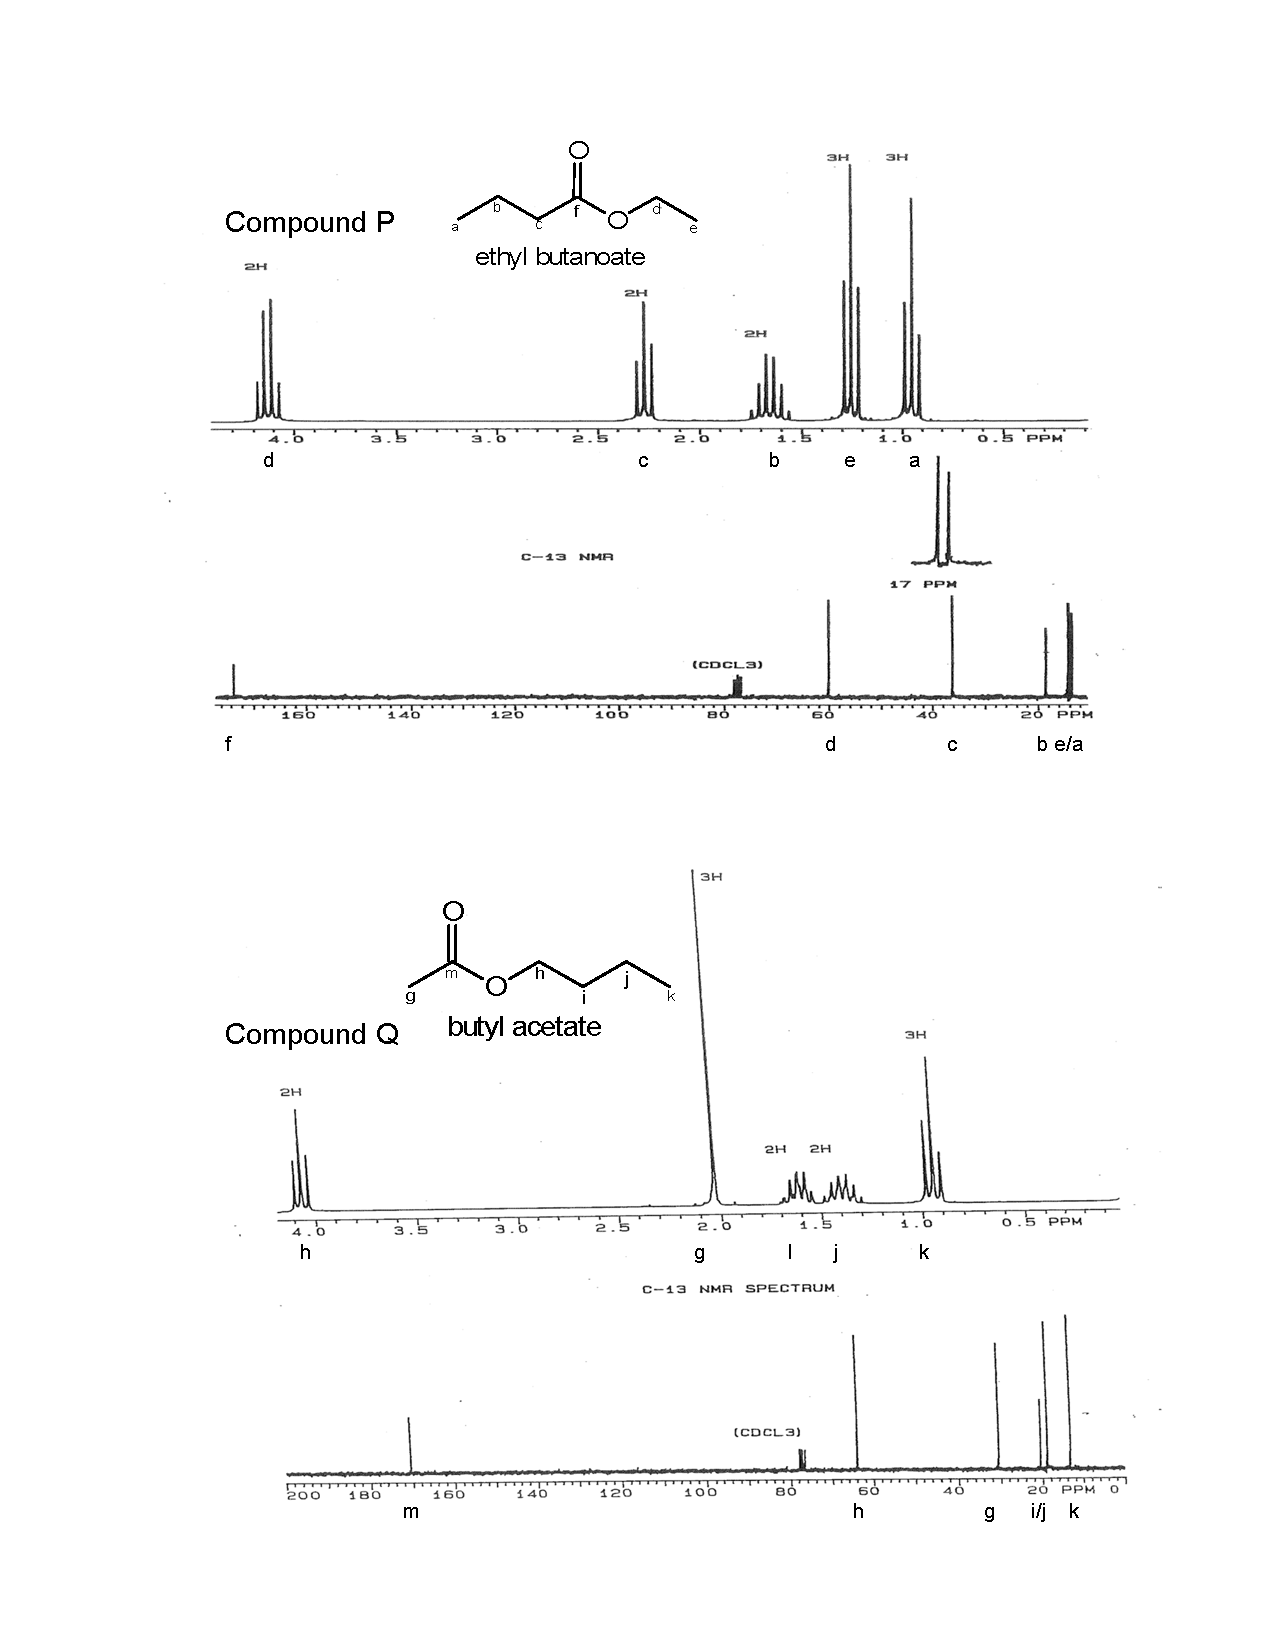
2. Esters are known for their sweet, fruity aromas. Compound P smells like pineapple and is used as a flavor enhancer for orange juices. Compound Q is responsible for the sweet smell of Red Delicious apples. Compounds P and Q are structural isomers with the following composition: 62.04% C, 0.41% H, and 27.55% O. The IR spectrum for each compound includes several moderate bands around 2940 cm-1, a strong band near 1740 cm-1, and a moderate band near 1200 cm-1. The 1H and 13C NMR spectrum for each compound is shown below.
Name, draw the bond-line structure, and correlate the NMR signals to their respective compound.

- Answer
-
2.

Contributors and Attributions
Dr. Dietmar Kennepohl FCIC (Professor of Chemistry, Athabasca University)
Prof. Steven Farmer (Sonoma State University)
William Reusch, Professor Emeritus (Michigan State U.), Virtual Textbook of Organic Chemistry
Jim Clark (Chemguide.co.uk)