Chemistry LibreTexts

2.3A: Overview of TLC

  • Page ID
    93523
  • \( \newcommand{\vecs}[1]{\overset { \scriptstyle \rightharpoonup} {\mathbf{#1}} } \) \( \newcommand{\vecd}[1]{\overset{-\!-\!\rightharpoonup}{\vphantom{a}\smash {#1}}} \)\(\newcommand{\id}{\mathrm{id}}\) \( \newcommand{\Span}{\mathrm{span}}\) \( \newcommand{\kernel}{\mathrm{null}\,}\) \( \newcommand{\range}{\mathrm{range}\,}\) \( \newcommand{\RealPart}{\mathrm{Re}}\) \( \newcommand{\ImaginaryPart}{\mathrm{Im}}\) \( \newcommand{\Argument}{\mathrm{Arg}}\) \( \newcommand{\norm}[1]{\| #1 \|}\) \( \newcommand{\inner}[2]{\langle #1, #2 \rangle}\) \( \newcommand{\Span}{\mathrm{span}}\) \(\newcommand{\id}{\mathrm{id}}\) \( \newcommand{\Span}{\mathrm{span}}\) \( \newcommand{\kernel}{\mathrm{null}\,}\) \( \newcommand{\range}{\mathrm{range}\,}\) \( \newcommand{\RealPart}{\mathrm{Re}}\) \( \newcommand{\ImaginaryPart}{\mathrm{Im}}\) \( \newcommand{\Argument}{\mathrm{Arg}}\) \( \newcommand{\norm}[1]{\| #1 \|}\) \( \newcommand{\inner}[2]{\langle #1, #2 \rangle}\) \( \newcommand{\Span}{\mathrm{span}}\)\(\newcommand{\AA}{\unicode[.8,0]{x212B}}\)


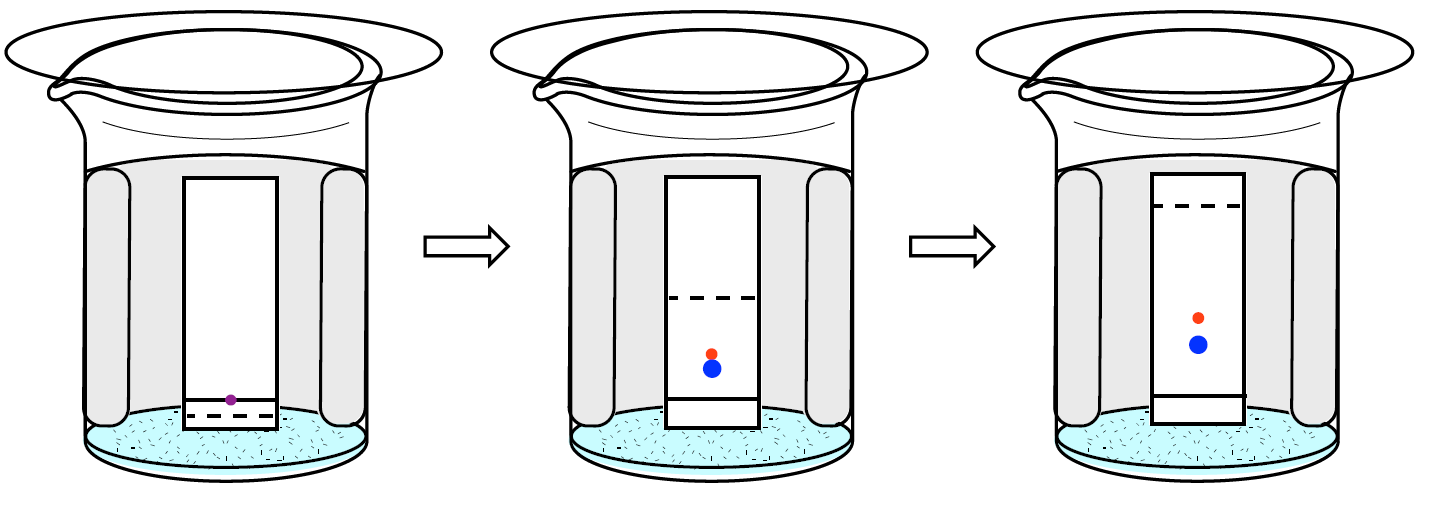
    Two commonly used stationary phases in chromatography are silica (\(\ce{SiO2} \cdot x \ce{H2O}\)) and alumina (\(\ce{Al2O3} \cdot x \ce{H2O}\)). Both of these materials are fine white powders that, unlike paper, do not stand up by themselves, so they are deposited in a thin layer on some sort of backing (either glass, aluminum, or plastic). Using these thin layers of stationary phase for separations is called "thin layer chromatography" (TLC), and is procedurally performed much the same way as paper chromatography (Figure 2.5).

    3 step sequence of T L C: before elution, during elution, and after elution.
    Figure 2.5: TLC sequence to separate the components of a purple sample.

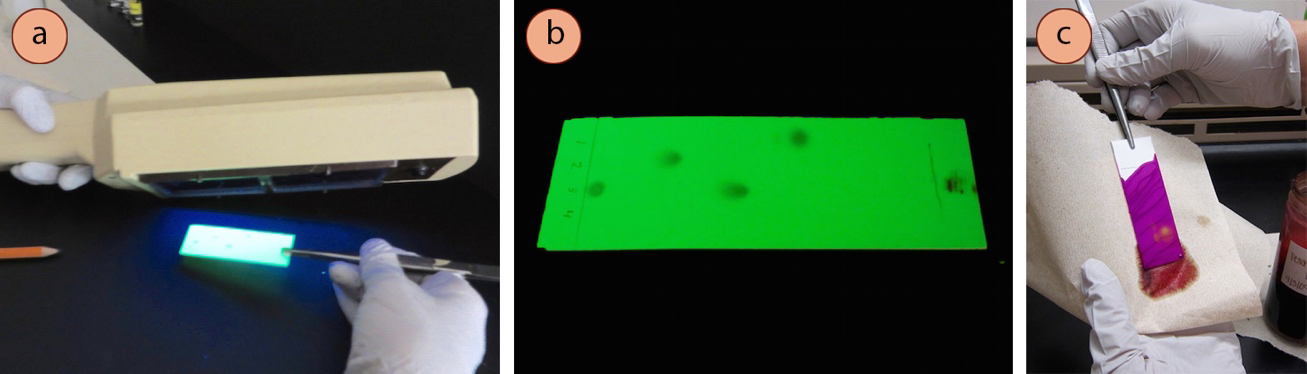
    It is very common for organic compounds to appear colorless on the white adsorbent background, which poses the challenge of seeing the separation that occurs in a TLC. TLC plates often have to be "visualized," meaning something has to be done to the plate in order to temporarily see the compounds. Common methods of visualization are to use UV light (Figures 2.6 a+b) or a chemical stain (Figure 2.6c).

    Visualizing TLC plate
    Figure 2.6: a) Visualization of a TLC plate using UV light, b) Compounds appear dark against a fluorescent green background, c) Use of a chemical stain to visualize a plate.

    Contributors and Attributions

    • Lisa Nichols (Butte Community College). Organic Chemistry Laboratory Techniques is licensed under a Creative Commons Attribution-NonCommercial-NoDerivatives 4.0 International License. Complete text is available online.


    This page titled 2.3A: Overview of TLC is shared under a CC BY-NC-ND 4.0 license and was authored, remixed, and/or curated by Lisa Nichols via source content that was edited to the style and standards of the LibreTexts platform; a detailed edit history is available upon request.

    • Was this article helpful?