
2.3E: Step-by-Step Procedures for Thin Layer Chromatography
- Page ID
- 93521

General TLC Procedure
The TLC pictured in this section shows elution of a TLC plate containing several samples of red food dye at different aqueous dilutions (0 = undiluted, 3 = 1 drop dye + 3 drops water, etc.).
.png?revision=1&size=bestfit&width=1107&height=321)
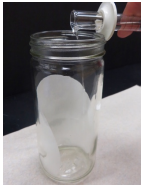
Dissolve the Samples
- Dissolve all the samples you want to run (solids and liquids) in small vials using a volatile solvent in which they are soluble (e.g. acetone, diethyl ether, or dichloromethane). Ideally the vials will have a lid to minimize vapors and preserve the samples if tipped over (Figure 2.23a).
The optimal concentration for TLC is typically determined empirically, but a good place to start is to use 50-100 times as much solvent as sample (i.e. 1 drop sample for \(\sim 1 \: \text{mL}\) solvent). If you have already prepared an NMR sample (\(\sim 5 \: \text{mg} / 0.75 \: \text{mL}\) for high field NMR), you can use that sample directly.
Label the vials. Also prepare a vial of clean acetone (or other solvent, e.g. \(\ce{CH_2Cl_2}\)) to be used to rinse the spotters in a later step. (A rinse vial of water is pictured in Figure 2.23a, as the dye solutions are water soluble.)
.png?revision=1&size=bestfit&width=1111&height=393)
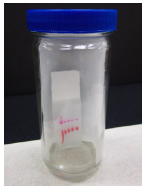
Prepare the TLC Chamber and Plate
- Obtain a TLC chamber with lid. An inexpensive chamber can be made using a beaker and watch glass (Figure 2.23b). Cut a piece of filter paper (or two) so that when placed in the chamber, the filter paper fits inside the chamber and is flat on the bottom but not obscuring your view of the inside (Figure 2.23c).
The filter paper keeps the chamber saturated with vapors so when the eluent rises on the plate it doesn't easily evaporate, but continues to climb and undergo the chromatography. If the eluent evaporated, movement would stop, but could also change the local composition of a mixed eluent and affect the results. - Add a portion of a prepared solvent for chromatography (Figure 2.23c, \(5\)-\(10 \: \text{mL}\) for this type of TLC chamber). Close the lid (or place the watch glass) and tilt the chamber to wet the filter paper.
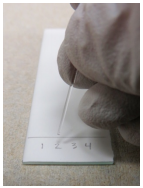
- Obtain a TLC plate, touching the plate only on the back or edges, but not on the white surface. Use a rule to lightly draw a straight line with a pencil\(^3\) roughly \(1 \: \text{cm}\) from the bottom. Do not gouge the silica or alumina.
.png?revision=1&size=bestfit&width=660&height=382)
- Label the areas with pencil where you plan to place the samples (Figure 2.23d). A one-inch wide TLC plate can comfortably accommodate three samples (have three lanes), and if the spot size is kept small it can fit at maximum five spots. If more than five spots are necessary on one plate, TLC plates can be purchased in sheets and cut wider than one inch.
The lanes should not be placed too close to the edge (keep at least \(5 \: \text{mm}\) away from each edge), as it is not unusual for solvent to travel slightly "fast" at the edge where capillary action of the solvent is greater (Figure 2.24).
The lanes should also not be placed too close to one another, or the spots may overlap after elution. A spot is always larger after elution compared to its original size (Figure 2.24b+c) because diffusion occurs in all directions (contact with a liquid spreads the material in both the horizontal and vertical directions). Broadening also occurs as solutes in the mobile phase move at different rates as the flow of eluent is weaker near the adsorbent surface. This can even sometimes cause compounds to get stuck in adsorbent pores where the flow of eluent is especially weak.\(^4\). Spot broadening means that samples deposited right next to each other on the baseline of a TLC plate will probably bleed together during elution.
.png?revision=1&size=bestfit&width=1103&height=365)
Spot the TLC plate with sample
- Obtain a capillary spotter (a very thin hollow piece of glass open at both ends). In some institutions, you may need to make your own spotter by stretching a softened pipette. Place your spotter into the diluted sample you want to analyze to withdraw liquid into the spotter through capillary action. If the liquid level is low in your vial and your spotter short, you may have to tip the vial to withdraw liquid (Figure 2.25a).
- Keeping the spotter mostly vertical, make a practice "spot" on a paper towel or scrap piece of silica or alumina to familiarize yourself with how the liquid delivers from the spotter. The spots should be very small, around \(2 \: \text{mm}\) in diameter. Deliver a very small spot of material on the pencil line of the appropriate lane (Figure 2.25b) using a quick "up and down" motion with your hand. Don't gouge the silica or alumina with the spotter.
- Still keeping the spotter vertical, immediately touch the spotter to a paper towel to expunge all of the liquid remaining in the spotter (Figure 2.25c). If the spotter is set down without immediate draining the liquid, air may get into the spotter making it impossible to dispense and use again.
- Rinse the spotter with acetone (or another volatile solvent with which your compounds are soluble, Figure 2.25d). Place the empty spotter in your rinse vial to withdraw liquid and drain the solvent onto a paper towel. Rinse once or twice before reusing the spotter for other samples.
.png?revision=1&size=bestfit&width=1103&height=385)
Place the TLC plate in the chamber to "elute"
- Use forceps to delicately place the TLC plate into the chamber (Figure 2.26a). Don't allow the liquid to splash onto the plate.
The liquid level must be below the pencil line where the samples are spotted or the compounds will dissolve in the pool of eluent instead of traveling up the plate. Cap the chamber delicately while keeping it vertical, and don't touch it again until the TLC is complete. - Allow the TLC to develop (Figure 2.26b-d). As liquid moves up the TLC plate it will appear transparent and wet. A dark background will allow the solvent front to be more easily seen. If the eluent is very polar (e.g. contains large amounts of ethanol or water), elution will take a relatively long time (can be 30-40 minutes). If the eluent is very nonpolar (e.g. contains large amounts of hexane or petroleum ether), elution will be relatively quick (can be 2-5 minutes for a \(10 \: \text{cm}\) tall plate).
- Depending on the goals of the TLC experiment, the chromatography can be stopped when the solvent level is anywhere between halfway to roughly \(0.5 \: \text{cm}\) from the top of the plate. It is best to let the TLC run to around \(0.5 \: \text{cm}\) from the top of the plate to get the best separation of spots and to minimize error in \(R_f\) calculations.
Remove the TLC plate from the chamber
- Open the TLC chamber, and remove the TLC plate with forceps. Immediately mark the solvent line with a pencil (Figure 2.26e) to enable an \(R_f\) calculation, as the solvent often readily evaporates. Alternatively, the silica can be lightly gouged with the forceps to mark the solvent front.
- If the compounds on the TLC plate are colored, the process is complete. If the compounds are colorless, they need to next be visualized.
Thin Layer Chromatography Summary
 |
 |
 |
 |
| Place a small portion of solvent (\(5\)-\(10 \: \text{mL}\) for this chamber) into a TLC chamber with lid, along with a cut piece of filter paper. | Dissolve liquid or solid samples (1 drop per \(\sim 1 \: \text{mL}\) solvent) using a low boiling solvent (e.g. acetone or dichloromethane). |
Draw a pencil line on a TLC plate \(\sim 1 \: \text{cm}\) from the bottom with a ruler, and mark the lanes. Don't put lanes too close to the edge or to each other. Spot a dilute sample on the pencil line of the correct lane, making very small spots (\(2 \: \text{mm}\) in diameter). Rinse the spotter with a solvent (e.g. acetone) if going to use it for another sample. |
Place the sample in the TLC chamber with forceps, cap it, and leave it alone. Remove the plate when the solvent line is \(\sim 0.5 \: \text{cm}\) from the top. Immediately mark the solvent line with a pencil. Visualize if necessary. |
Table 2.3: Procedural summary for TLC.
TLC Troubleshooting
The spots are streaky or "blobby"
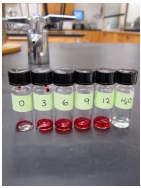
The components of a sample can appear as long streaks or "blobby" spots on a TLC plate if the samples are run at too high a concentration.
For example, Figure 2.27b shows an eluted TLC plate containing five red food dye samples of different concentrations (lane 0 contains the dye in the concentration found at the grocery store; lane 3 contains 1 drop of dye diluted with 3 drops of water, etc.). After elution, the red and pink components from the undiluted dye (lane 0) streaked severely, as the TLC plate was "overloaded". When this happens proper equilibration between stationary and mobile phases does not occur. With further dilution (lane 12), the streaking disappeared and the spot shapes sharpened.
If streaking is seen on a TLC plate, the sample should be diluted and run again.
.png?revision=1&size=bestfit&width=886&height=370)
Figure 2.27c also demonstrates how dilution can improve the shape of a spot after elution. In this TLC, alkene and alkyne samples were spotted at somewhat high concentrations, while an improved dilution was used in Figure 2.27d. Note how the \(R_f\) appears to change in the two TLC plates. The more accurate \(R_f\) is of the diluted sample. Running TLC on concentrated samples gives inaccurate \(R_f\) values and may hide multiple spots.
The spots ran unevenly
At times the solvent front may run unevenly on a TLC plate. This may occur if the plate was placed in the chamber at a slight tilt, if eluent splashed onto the plate during placement in the chamber, or if the chamber was jostled during elution. In cases where the front is dramatically different from one position to the other, the front should be measured for each lane of the plate (if calculating an \(R_f\)) instead of only once.
Making Capillary TLC Spotters
Although capillary spotters for TLC can be purchased, some chemists prefer to create their own by stretching Pasteur pipettes (Figure 2.28). To make a spotter, hold a pipette by the edges while wearing thick gloves and position the middle of the pipette into the flame of a large Meker burner (Figure 2.28a). Warm the pipette until the glass becomes quite pliable (borosilicate glass softens at \(820^\text{o} \text{C}\),\(^5\) so this will take some time). Only rotate, but do not stretch the pipette at all while the pipette is in the flame. Then remove the pipette from the flame and immediately and rapidly pull the pipette to an arm's length. The thin sections can be broken into 6-12 inch segments and used for TLC.
.png?revision=1&size=bestfit&width=1121&height=364)
Notebook Record of TLC's
Some chemists scan, photograph, or electronically record their developed TLC plates, but it is much more common to copy a likeness of a TLC plate by hand into a laboratory notebook. It is important to copy a TLC plate "to scale", meaning the dimensions should be the same in the notebook as they are in actuality.
To accomplish this, the TLC plate can be placed atop a notebook page and a rendering created beside it (Figure 2.29c). The back of the TLC plate should previously be wiped clean or else staining reagents may degrade the paper. It is important to copy the TLC plate as accurately as possible, drawing the spots exactly as they appear, even if they are streaky or blobby. All spots seen in a lane should be recorded, even if they are faint. Good record keeping means to record all observations, even if the importance is unknown; a faint, unexpected spot may become relevant at a later time.
.png?revision=1&size=bestfit&width=1110&height=446)
Several other notations should be made along with the sketch of the TLC plate (Figure 2.29d). The solvent system and identity of what was spotted in each lane must be recorded. For each spot, an \(R_f\) should be calculated (some chemists like to write the measurements on the TLC plate; see the plate in Figure 2.29d) along with notation of UV activity and stain color. If a spot changes appearance over time, as the orange spot in Figure 2.29b faded to light green over time (Figure 2.29d), the initial appearance should be recorded.
.png?revision=1&size=bestfit&width=1101&height=416)
\(^3\)The graphite in pencil will not travel with the eluent, but pen ink would.
\(^4\)J. Sherman and B. Fried, Handbook of Thin Layer Chromatography, 1991.
\(^5\)G. L. Weissler, Vacuum Physics and Technology, 2\(^\text{nd}\) edition, 1979, p. 315.