
5.3: MELTING POINT ANALYSIS- IDENTITY AND PURITY
- Page ID
- 135965

The melting point of a compound is useful in two ways: it says something about the identity of a compound, and something about the purity of a compound. The presence of impurities will influence the melting point of a compound, leading to wider and depressed melting point ranges. Because even small deviations in melting point ranges is meaningful, it is worth mentioning that a control should be made when running the melting point of an isolated compound, against a stock sample of the same compound. In general, a deviation of more than 1 oC in obtained melting point usually means the material is not of acceptable purity. Because the margin is relatively small, it is always worth running your sample with an authentic sample of the compound in the same melting point apparatus. If there are even small deviations in the apparatus, you will find that the authentic sample’s melting point is also deviating from the literature value.
 Melting points are usually not the only analytical data obtained for a sample; routinely IR-spectroscopy is also performed. Any abnormality in either data set should reflect in the other data source. For example, an IR spectrum corresponding to a product with a depressed melting point will often show peaks that are not expected for a pure sample. It is worth noting that this is not necessarily the case, as the impurities must also produce strong peaks in non-crowded areas of the IR-spectrum to be detectable.
Let us look at a specific example. A student recrystallized a sample of 2-naphthol from ethyl acetate. The published literature on 2-naphthol lists its melting point as 121-123 °C, but the student’s sample melted from 115- 121 °C, a range that was much broader and much lower than the literature one.
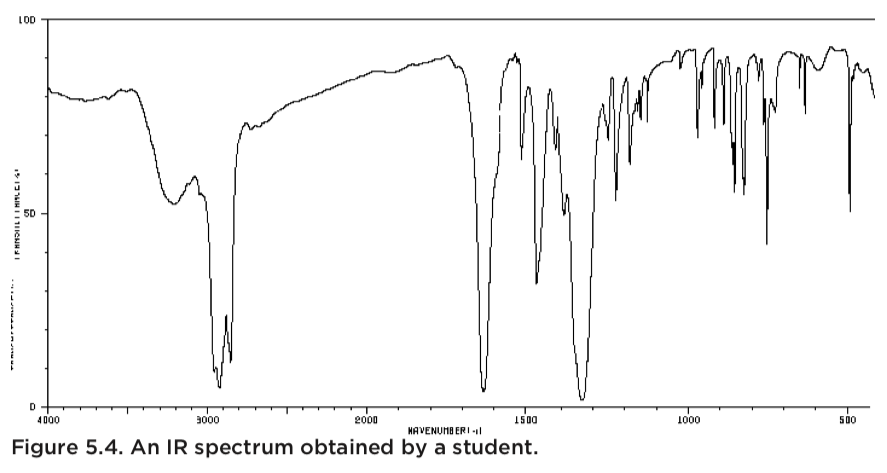
These data are a clear indication that the product is not pure, but it always is preferable to be able to identify the source of the impurity as opposed to simply stating that there were impurities present. The key to this puzzle is found in the student’s IR -spectrum.
You will notice a clear indication of an OH-bond (around 3200 cm-1) that is likely due to 2-naphthol, but you will also notice something else: a clear C=O peak. It is very likely that this is trace ethyl acetate left over from the recrystallization, which indicates that the sample was not allowed to air-dry sufficiently.
A powerful observation is found when the two analyses are combined and viewed together.