
1.6: Rate Laws
- Page ID
- 189837

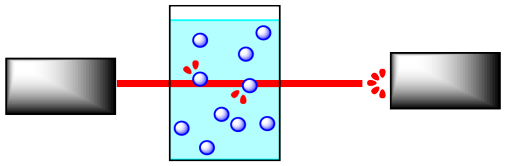
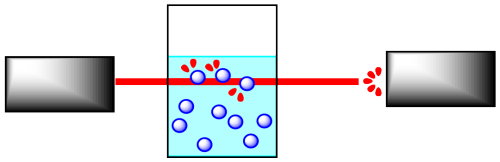
So far, we have talked about changes in the number of molecules over time as a reaction progresses. The number of reactant molecules decreases as the number of product molecules increases. Practically, the easiest way to measure the speed of a reaction is to measure the concentration over time. We can measure either the concentration of the reactants or the products. Remember, concentration refers to how densely populated a solution is with a particular compound.
The concentration of black dots is higher in the beaker on the right than in the beaker on the left.
Reactions are often monitored by some sort of spectroscopy. In spectroscopy, "light" or some other frequency of electromagnetic radiation shines through a sample in which a reaction is taking place. The light can interact with the molecules in the sample. The molecules absorb particular frequencies of light, so if the light encounters the molecules on its way through the sample, a little of the light at those frequencies is absorbed. Less light makes it all the way through the sample; the amount that does make it through is measured by a detector on the other side.
If the concentration of the sample is different, a different amount of light from the spectrometer will be absorbed. For instance, suppose the sample is more concentrated. The more molecules there are, the more light is absorbed. And because the beam of light travels through the sample in a straight line, the more concentrated the solution, the more molecules it will encounter.
It is pretty simple to calibrate the instrument to be able to determine concentration from the amount of light absorbed. In addition, the light may interact with the reactant molecules and product molecules in different ways. That means you can monitor the absorption of a frequency that you know is absorbed by reactant molecules, but not by product molecules, and you can detect changes in reactant concentration. You could also do the same thing to detect changes in product concentration.
We sometimes write the rate of the reaction as:
\[Rate = \frac{d[product]}{dt} \nonumber\]
Meaning, the rate is the change in concentration of product with change in time.
Concentration could be measured in any units. Frequently, we are dealing with a solution, and we use units such as grams per liter or, much more commonly, moles per liter. The change in time is most often measured in seconds.
We could also write the rate of the reaction as:
\[Rate = \frac{-d[reactant]}{dt} \nonumber\]
Meaning, the rate is the change in concentration of reactant with change in time. The minus sign just means that the reaction is getting consumed over time as it turns into product, so its concentration is decreasing.
Kinetic studies are important in understanding reactions. Not only are they important in industry, but they are also used to understand biological processes, especially enzyme-catalyzed reactions. They also play a role in environmental and atmospheric chemistry, as part of an effort to understand a variety of issues ranging from the fate of prescription pharmaceuticals in wastewater to the cascade of reactions involved in the ozone cycle.
Suppose the rate of the reaction between the black circles and the white circles depends only on the concentration of the black circles. That is, rate = k [black circle]. Compare the rate in each case to the rate of the reaction that would occur in the original beaker.
- Answer a
-
Rate of (a) = 1/2 x Rate of original
- Answer b
-
Rate of (b) = 1/2 x Rate of original
- Answer c
-
Rate of (c) = 3/4 x Rate of original
- Answer d
-
Rate of (d) = 1/2 x Rate of original; although the number of molecules is the same as the original, the volume is doubled. As a result, the concentration is cut in half.
- Answer e
-
Rate of (e) = 2 x Rate of original; although the number of molecules is the same as the original, the volume is halved. As a result, the concentration is doubled.
- Answer f
-
Rate of (f) = Rate of original; although the number of molecules is doubled, the volume is also doubled, leaving the concentration unchanged.
Suppose the rate of the reaction between the black circles and the white circles depends on both the concentrations of the black circles and the white circles. That is, rate = k [black circle][white circle]. Compare the rate in each case to the rate of the reaction that would occur in the original beaker.
- Answer a
-
Rate of (a) = 1/2 x Rate of original
- Answer b
-
Rate of (b) = 1/2 x 1/2 = 1/4 x Rate of original
- Answer c
-
Rate of (c) = 2 x Rate of original
- Answer d
-
Rate of (d) = 1/2 x 1/2 = 1/4 x Rate of original; although the number of molecules is the same as the original, the volume is doubled. As a result, the concentration is cut in half.
- Answer e
-
Rate of (e) = 2 x 2 = 4 x Rate of original; although the number of molecules is the same as the original, the volume is halved. As a result, the concentration of each reactant is doubled.
- Answer f
-
Rate of (f) = Rate of original; although the number of molecules is doubled, the volume is also doubled, leaving the concentration unchanged.
Suppose the rate of a reaction in the beaker depends on the surface area of the solid at the bottom of the beaker. That is, rate = k x (surface area of white circles). Compare the rate in each case to the rate of the reaction that would occur in the original beaker.
- Answer a
-
Rate of (a) = Rate of original; the surface area of the white solid appears to be the same.
- Answer b
-
Rate of (b) = 1/2 x Rate of original; the surface area of the white solid appears to be cut in half.
- Answer c
-
Rate of (c) = 2 x Rate of original; the surface area of the white solid appears to be doubled.
- Answer d
-
The smaller sizes of the particles in (d) makes it harder to answer this question. Let's assume these white solids are spherical and that the radius of a sphere in (d) is half that of a sphere in the original. The surface area of a sphere is A = 4 π r2. The ratio of surface areas of one sphere to another is \frac{A_{1}}{A_{2}} = \frac {4 \pi r_{1}^{2}}{4 \pi r_{2}^{2}} = \frac{r_{1}}{r_{2}}^{2}\). The ratio of surface areas of an original sphere to a sphere in (d) is \(\frac{A_{d}}{A_{0}} = \frac{1}{2}^{2} = \frac{1}{4}\). However, there are 12 spheres in (d) and only 4 spheres in the original. Thus, the ratio of total surface areas \(\frac{A_{dT}}{A_{0T}} = \frac{12}{4} \times \frac{1}{4} = \frac{3} {4}. The estimated rate of (d) = 3/4 x the Rate of original.
- Answer e
-
Let's assume these white solids are spherical and that the radius of a sphere in (e) is one quarter that of a sphere in the original. The ratio of surface areas of an original sphere to a sphere in (e) is \(\frac{A_{e}}{A_{0}} = \frac{1}{4}^{2} = \frac{1}{6}\). However, there are 40 spheres in (e) and only 4 spheres in the original. Thus, the ratio of total surface areas \(\frac{A_{eT}}{A_{0T}} = \frac {40}{4} \times \frac{1}{16} = \frac {5}{8}\). The estimated rate of (e) = 5/8 x the Rate of original.
- Answer f
-
Rate of (f) = Rate of original; the surface area of the white solid appears to be the same.
Often in studying reaction kinetics, the changing concentration of a reactant or a product is plotted against time. In one method, many data points are collected very early in a reaction (when fewer than 5% of the material has reacted), and the slope of the resulting line is used to determine the "initial rate". Explain why this method might not work if the data points are plotted all the way until the reaction is finished.
- Answer
-
At the very start of the reaction, the concentrations of reactants have not changed very much. That means the rate of the reaction remains roughly constant as the first few percent of reactants are consumed. Plotting [product] vs. time gives a straight line with the slope = rate. However, over the course of the reaction, the concentration of reactants goes down as the reactants are consumed. That means the rate of product formation slows down and a plot of [product] vs. time becomes curved. We will be unable to measure the slope in a simple way.
Suppose the following plots were obtained before 5% conversion for the reaction:
\[A + B \rightarrow C \nonumber\]
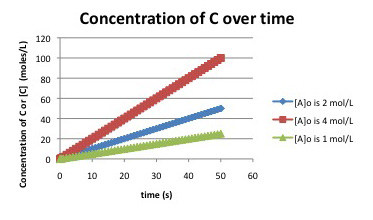
What do you know about the rate law for the reaction?
- Answer
-
The slope of the first curve, with [A]o = 1 mol L-1, can be estimated by observing that [C] increases from zero to 25 mmol L-1 in 50 seconds. The slope is about 25/50 = 0.5 mmol L-1 s-1. The slope of the next curve, with [A]0 = 2 mol L-1, is 1.0 mmol L-1 s-1 (50 mmol L-1 / 50 s). The initial concentration is doubled, and the rate doubles. The slope of the final curve, with [A]0 = 4 mol L-1, is 2.0 mmol L-1 s-1 (100 mmol L-1 / 50 s). The initial concentration is doubled, and the rate doubles. The reaction is linearly dependent on the concentration of A. Whatever happens to [A] also happens to the rate.
In terms of rate laws, there is a mathematical approach to demonstrating this relationship.
Suppose \(Rate = k [A]^{x}\); x is the power of the mathematical relationship.
The ratio of rates in two experiments is \(\frac{Rate_{1}}{Rate_{2}} = \frac{k[A_{1}]^{x}}{k[A_{2}]^{x}}\).
If we take the logarithm of both sides: \(ln \frac{Rate_{1}}{Rate_{2}} = ln (\frac{[A_{1}]}{[A_{2}]})^{x} = x ln \frac{A_{1}}{A_{2}}\)
Then \(x = ln \frac{Rate_{1}}{Rate_{2}}/ ln \frac{[A_{1}]}{[A_{2}]}\)
Suppose the following plots were obtained before 5% conversion for the reaction:
\[A + B \rightarrow C \nonumber\]
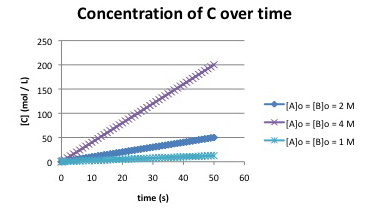
a) What is a possible rate law for the reaction?
b) Two different rate laws could explain this data. What is the second possible rate law?
c) Propose an experiment to distinguish between these two possible rate laws.
- Answer a
-
Each time the concentrations double (for example, from 2 to 4 mol L-1), the rate quadruples (for example, from 50/50 = 1 mmol L-1 s-1 to 200/50 = 4 mmol L-1s-1). One explanation is \(Rate = k[A][B]\)
- Answer b
-
Another explanation is \(Rate = k[A]^{2}\) or \(Rate = k[B]^{2}\).
- Answer c
-
We could run a series of experiments in which [A] is changed while holding [B] constant (or vice versa).
Suppose the following data were obtained by monitoring the following reaction to completion:
\[A + B \rightarrow C \nonumber\]
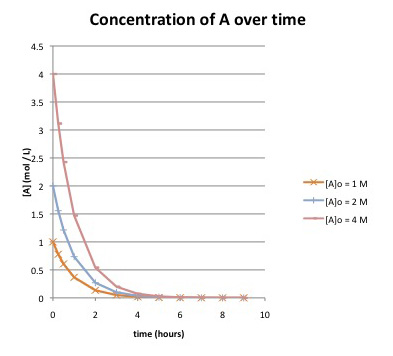
a) How long does it take until the reaction is essentially finished, if the starting concentration of A is:
i) 1 mol/L?
ii) 2 mol/L?
iii) 4 mol/L?
b) What do you know about the rate law for the reaction? Explain.
Suppose the following data were obtained by monitoring the following reaction to completion:
\[A + B \rightarrow C \nonumber\]
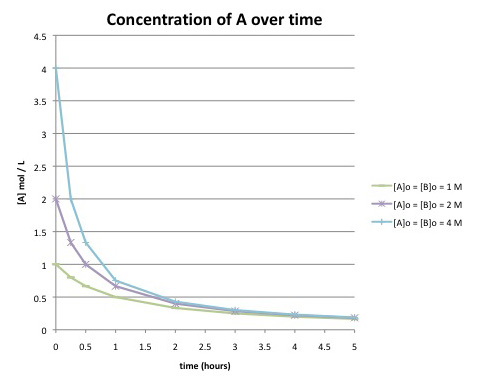
Compare this graph to the one in the previous problem. What differences can you detect in the curves? Do you think this reaction has the same rate law as the previous one?