
5.6: More Practice with 2D
- Page ID
- 189780

The following problems involve real samples. Note that you may need to check for peaks due to solvent. Helpful tables may be found here.
Exercise \(\PageIndex{1}\)
The following problems involve real samples. Note that you may need to check for peaks due to solvent. Helpful tables may be found here.
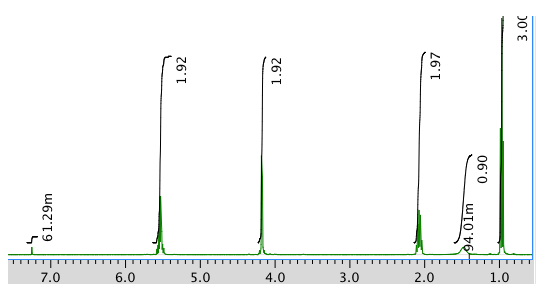
Note that the m beside one of the integral values stands for milli (one thousandth). 61.29m = 0.06129 units.
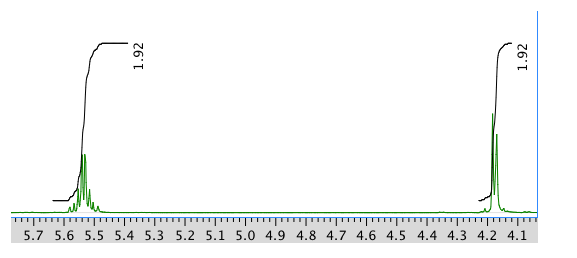
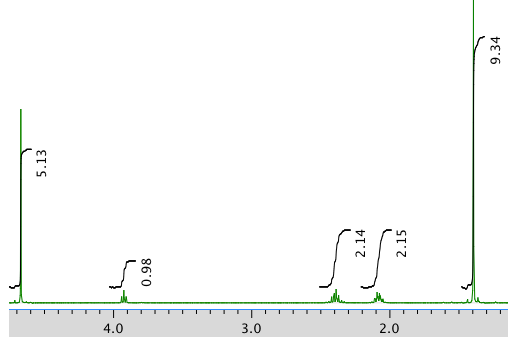
An expansion of the 1H NMR spectrum:
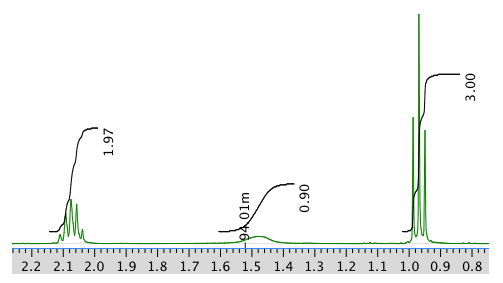
Another expansion:
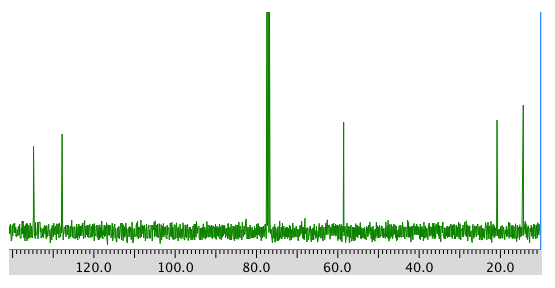
A 13C NMR spectrum:
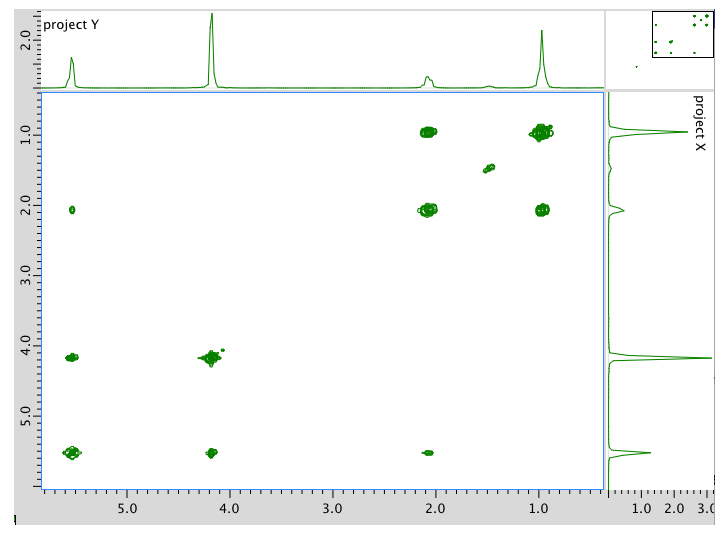
COSY spectrum:
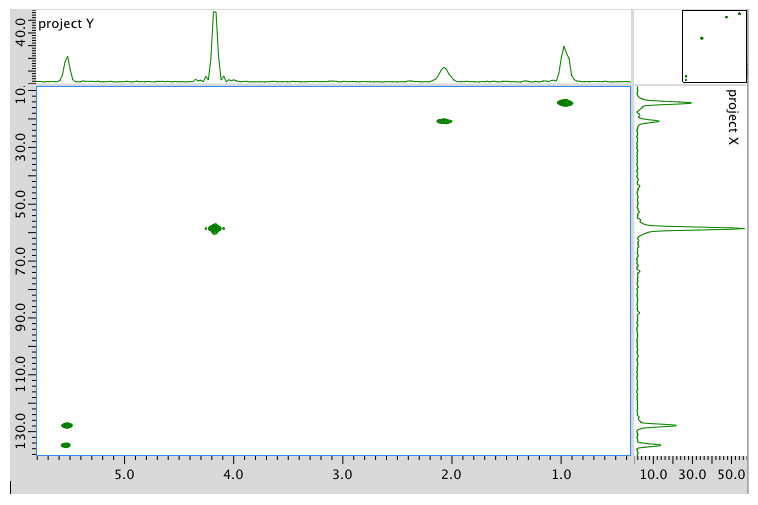
HMQC spectrum:
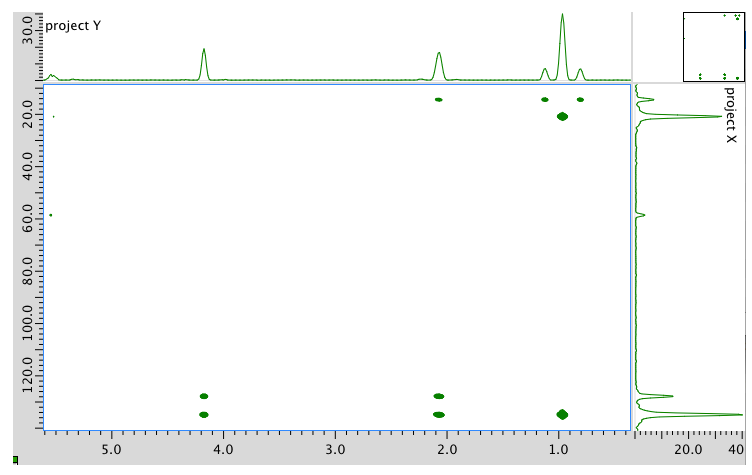
HMBC spectrum:
- Answer
-
1H NMR
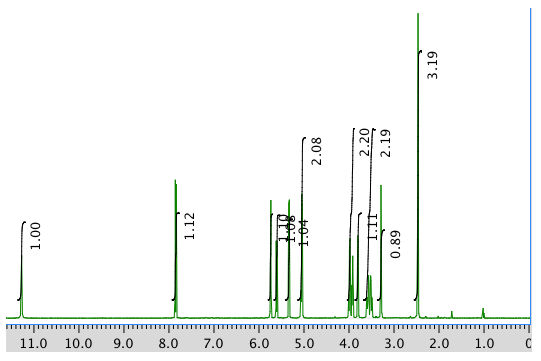
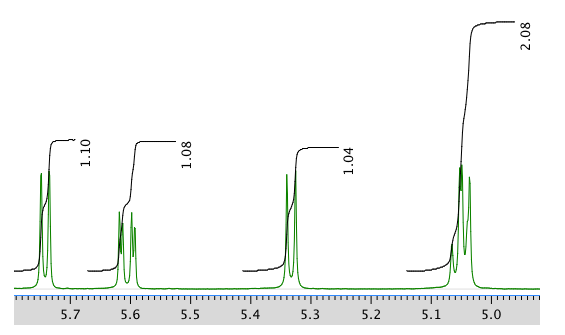
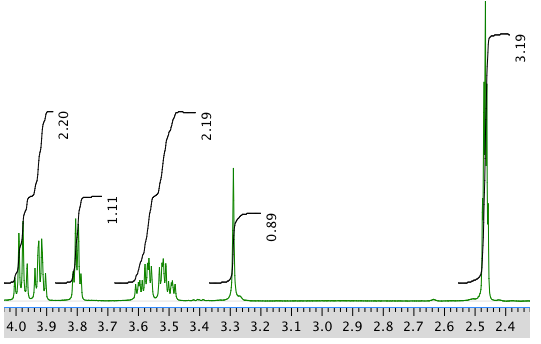
Chemical shift (ppm) Integration Multiplicity Partial Structure 5.54 2H multiplet CH=C (x 2) 4.17 2H doublet O-CH2-CH 2.08 2H quintet CH-CH2-CH3 1.47 1H boad singlet OH 0.95 3H triplet CH2-CH3 * total # H: 10
13C NMR
Chemical shift (ppm)
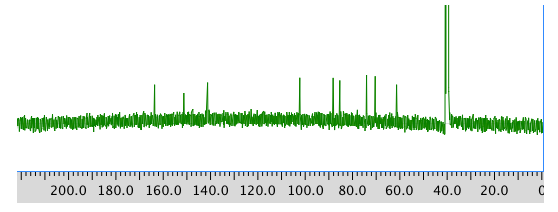
Type of carbon 134 sp2 128 sp2
58 sp3-O 21 sp3 14 sp3 *total # C: 5
COSY
Assignment 1H COSY A 0.95 2.08 B 2.08 0.95, 5.54 C 4.17 5.54 D 5.54 2.08 E 5.54 4.17 *HMQC indicates two hydrogens at 5.54 are in two different environments
HMQC
Assignment 13C 1H A 14 0.95 B 21 2.08 C 58 4.17 D 128 5.54 E 134 5.54 Formula:
C5H10O (1 O indicated from shift in 13C, 1H NMR)
FW = \(5 \times 12) + (10 \times 1) + (1 \times 16) = 86\)
Compare C5H10 ratio to C5H12 in hydrocarbon
Degrees of unsaturation = \(\frac{(2 \times 5) + 2 - 10}{2} = 1 unit (1 double bond)
The data tables should be consitent with this structure:
pent-2-en-1-ol (could be cis or trans based on this analysis)
Exercise \(\PageIndex{2}\)
Present an analysis of the following data and propose a structure.
MW: 202 amu
The full 1H NMR spectrum in D2O:
An expansion:
13C NMR:
COSY:
- Answer
-
1H NMR:
Chemical shift (ppm) Integration Multiplicity Partial structure 4.7 5H singlet solvent 3.93 1H triplet CH2-CH-N 2.40 2H multiplet CH2-CH2? 2.09 2H multiplet CH2-CH2? 1.4 9H singlet C(CH3)3 *Total number of H: 19 H
13C NMR:
Chemical shift (ppm) Type of carbon 170 sp2 (C=O) 80 sp3 (C-O) 52 sp3 (C-N) 32 sp3 28 sp3 26 sp3 *Total number of C: 6 apparent, but two more suggested by symmetry (3 methyl groups in 1H NMR) for 8 C; a third extra suggested by MW fit for 9 C
COSY:
Assignment 1H COSY Solvent 4.7 -- B 3.93 2.40 D 2.40 2.09 C 2.09 2.40, 2.09 A 1.4 -- Formula:
C9H18O3N2 (extra O indicated from shift in 13C, 1H NMR; second O suggested by C=O in 13C NMR; additional CO needed to fit MW)
FW = \((9 \times 12) + (18 \times 1) + (3 \times 16) + (2 \times 14) = 202\)
FW = ((9 \times 12) + (18 \times 1) + (3 \times 16) + (2 \times 14) = 202\)
Compare C9H18 to C9H22 for the corresponding hydrocarbon corrected for two nitrogens (therefore two extra hydrogens)
Degrees of unsaturation = \(\frac{(2 \times 9) + 2 + 2 - 10}{2} = 2\) units (2 double bonds)
The data tables should be consistent with this structure:
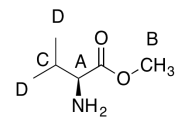
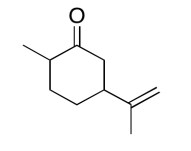
Exercise \(\PageIndex{3}\)
Present an analysis of the following data and propose a structure.
MW: 164 amu
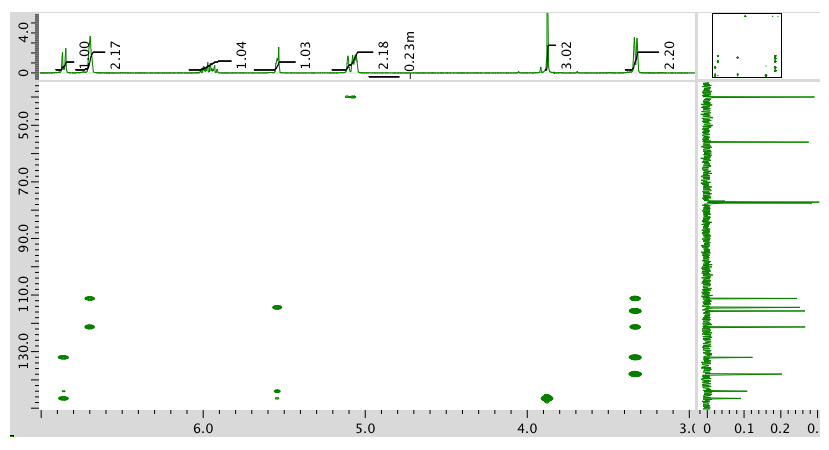
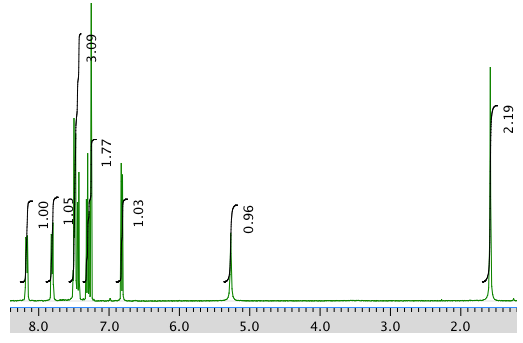
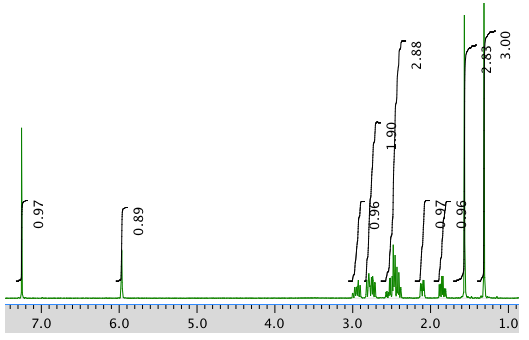
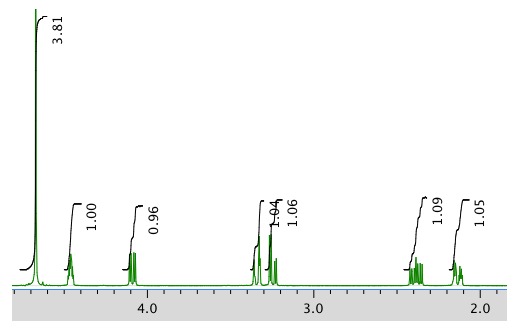
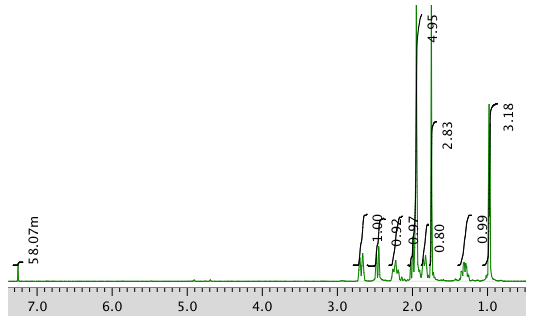
The full 1H NMR spectrum in CDCl3:
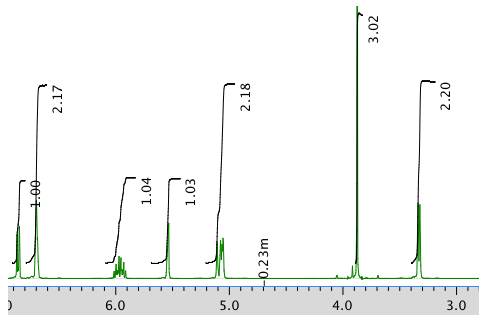
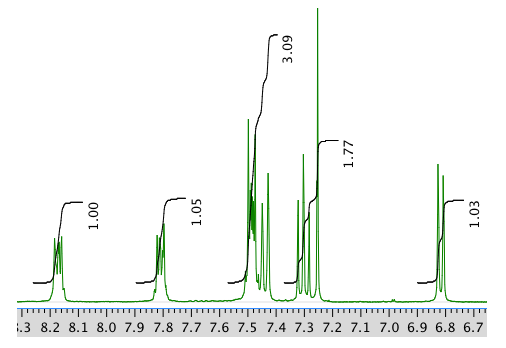
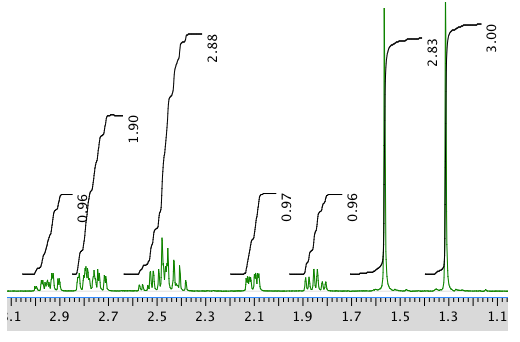
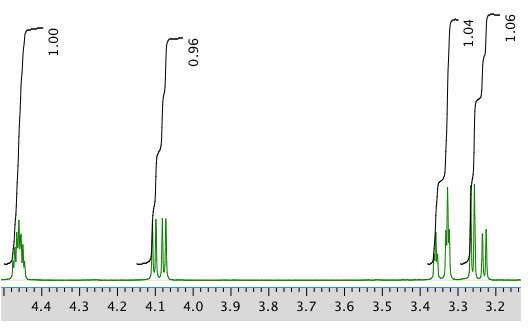
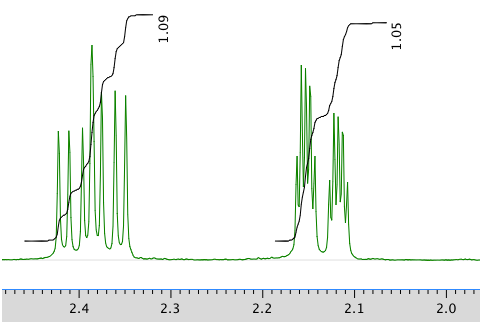
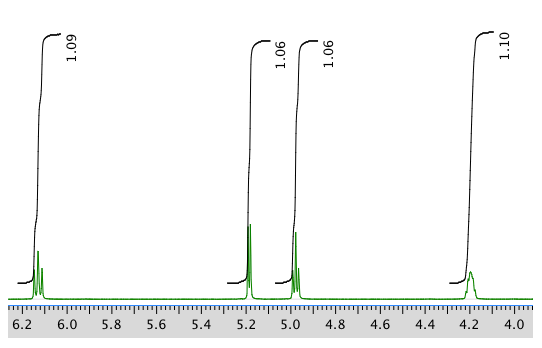
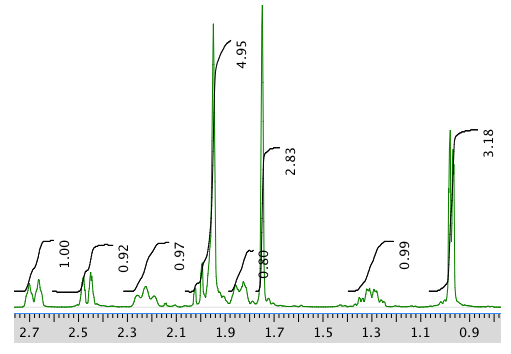
An expansion of the 1H NMR spectrum:
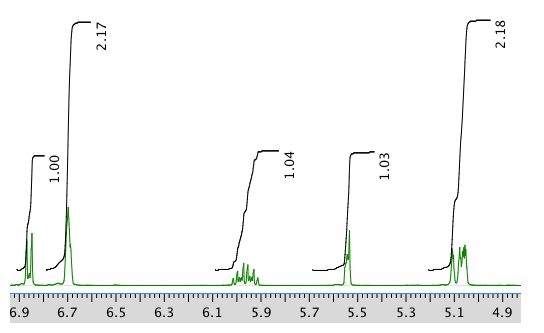
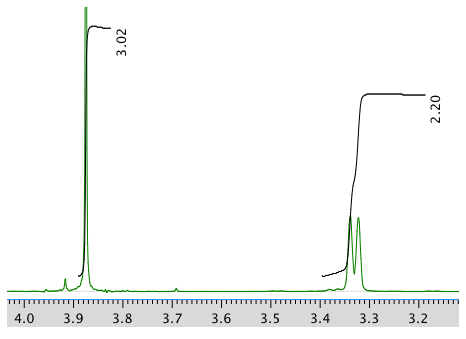
Another expansion:
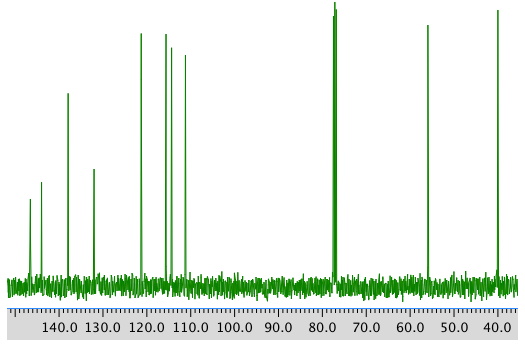
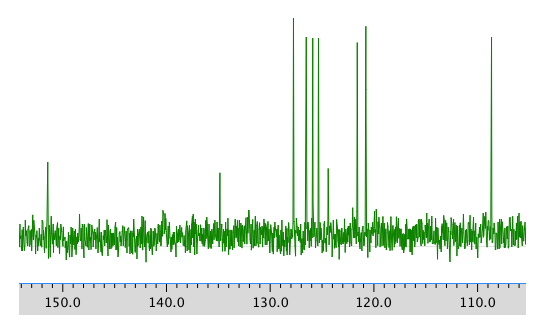
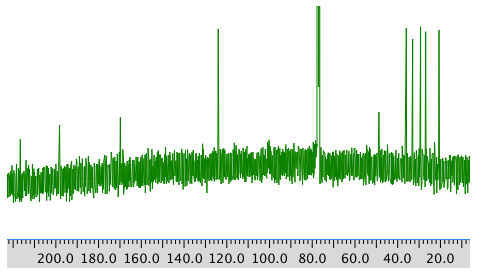
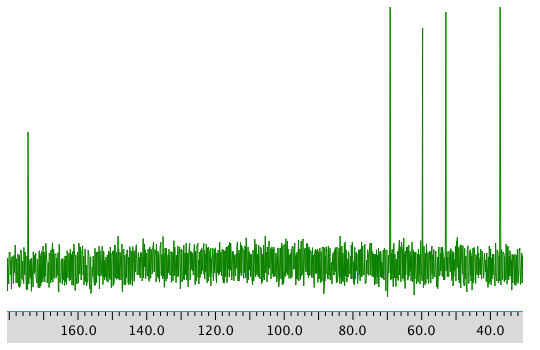
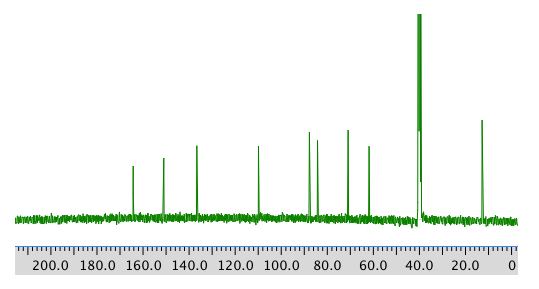
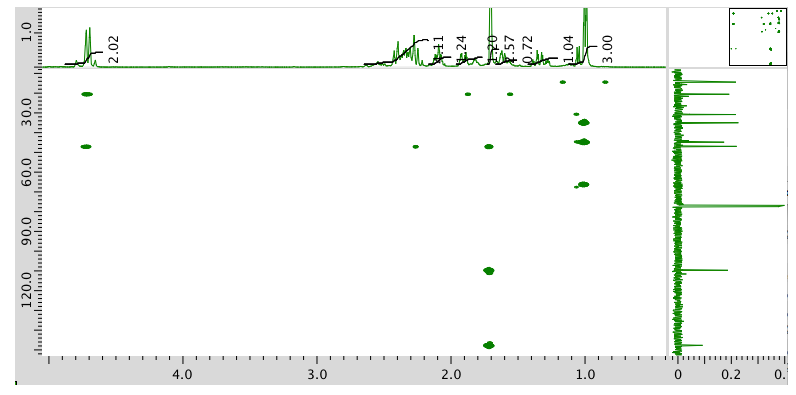
13C NMR spectrum:
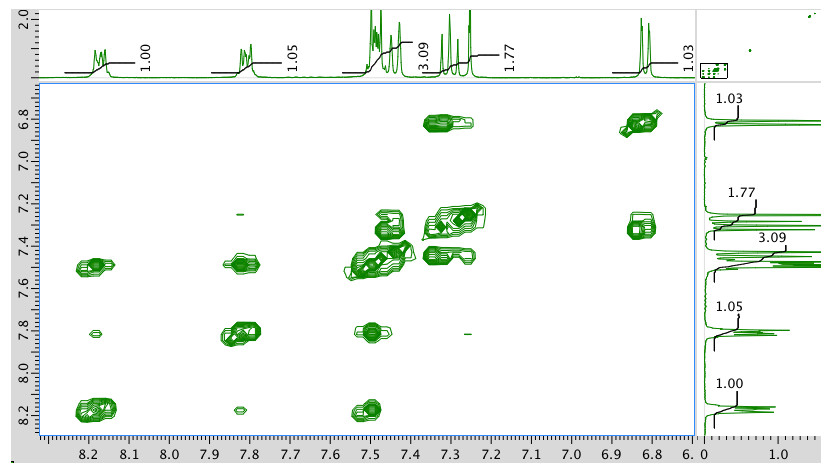
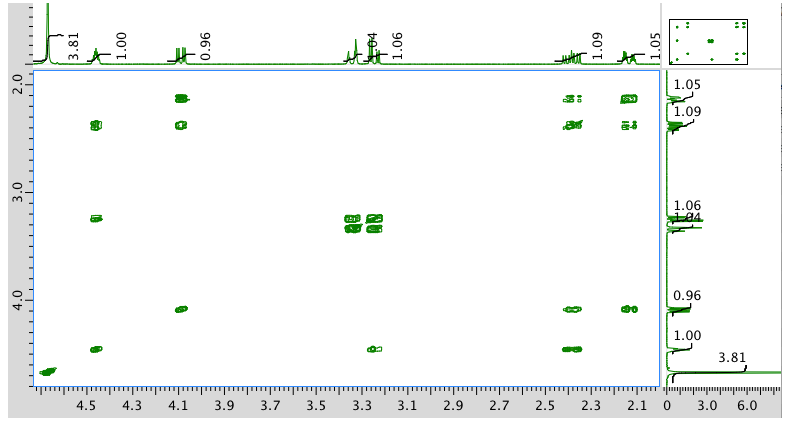
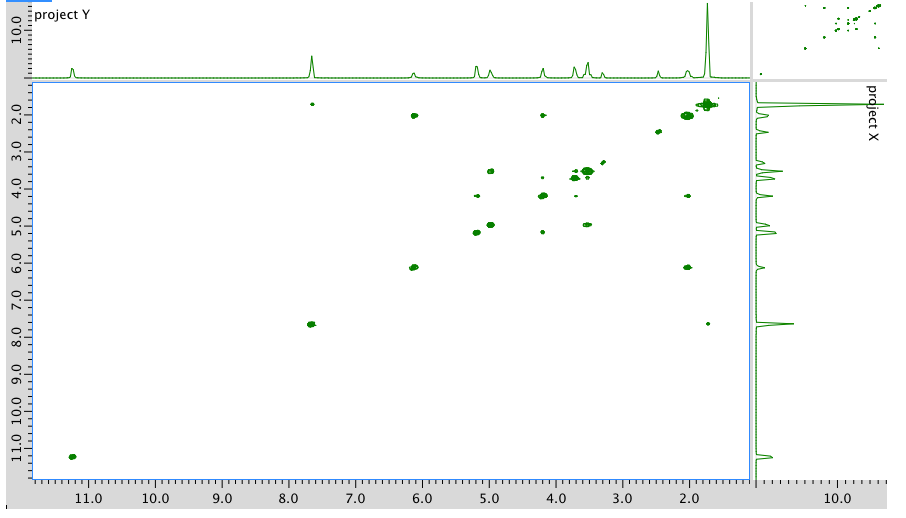
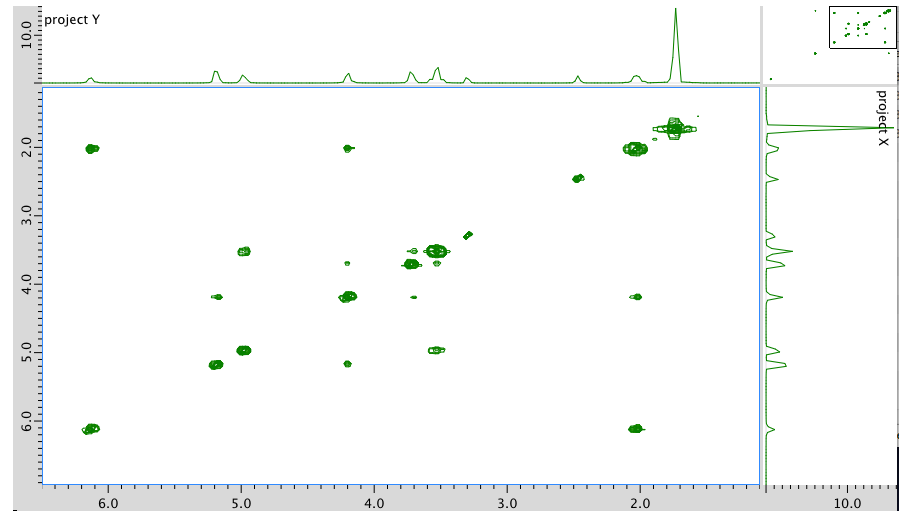
COSY spectrum:
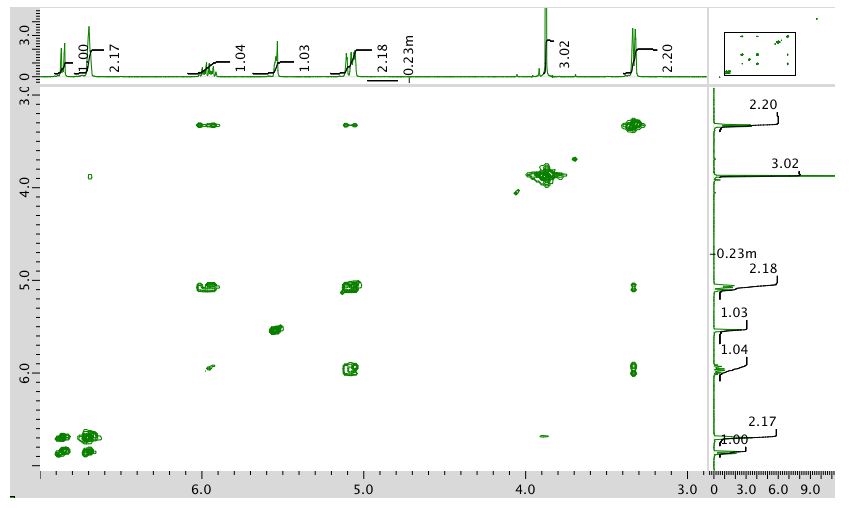
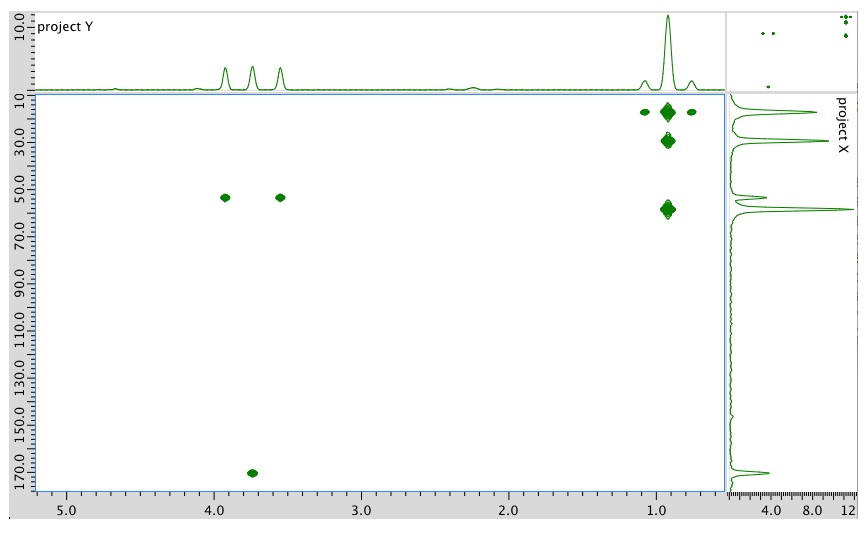
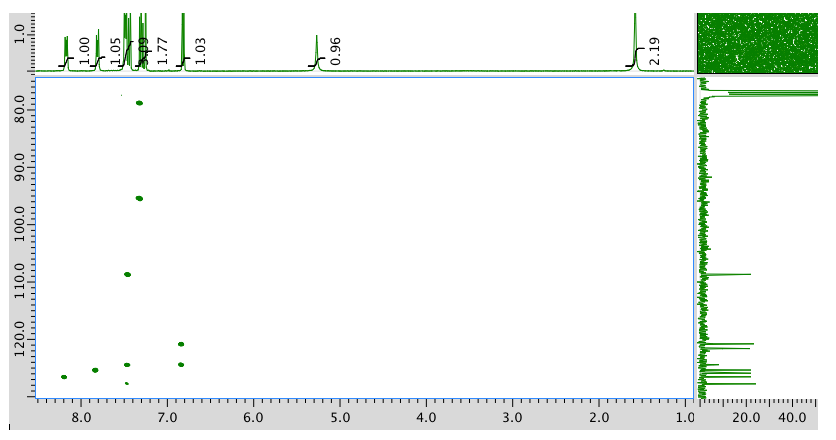
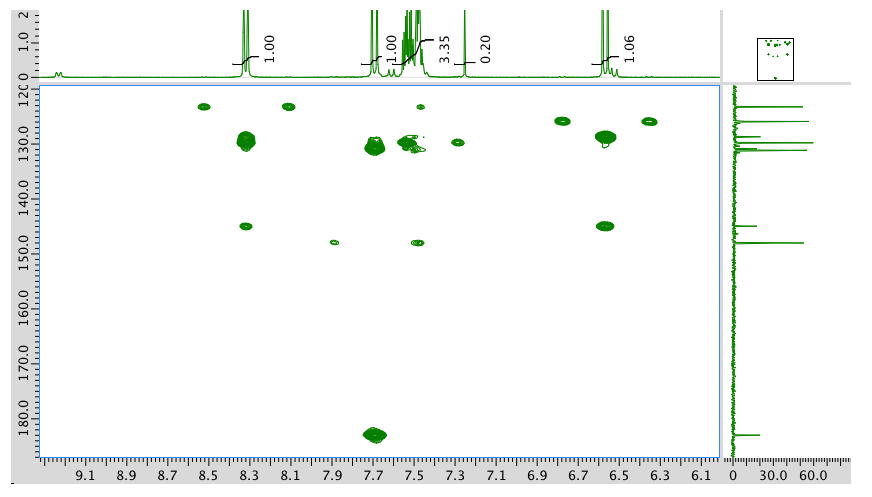
HMQC:
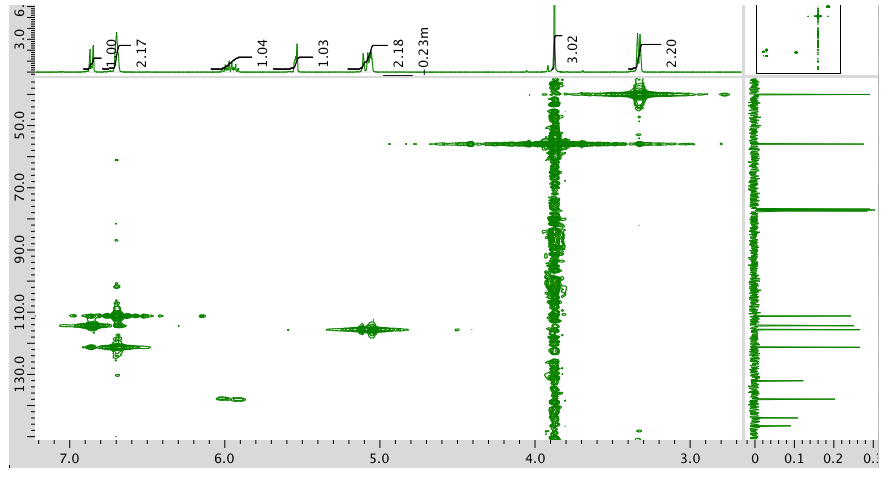
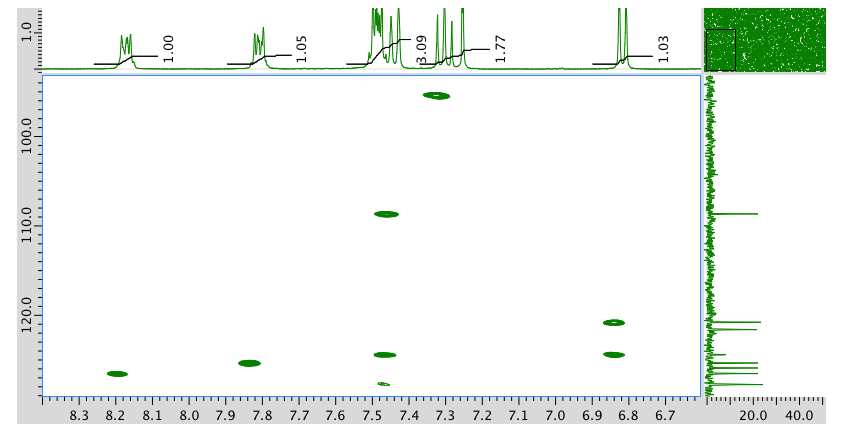
HMBC:
- Answer
-
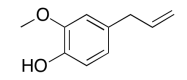
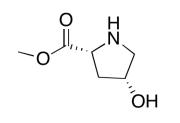
The data should be consistent with this structure:
Exercise \(\PageIndex{4}\)
Present an analysis of the following data and propose a structure.
MW: 131 amu
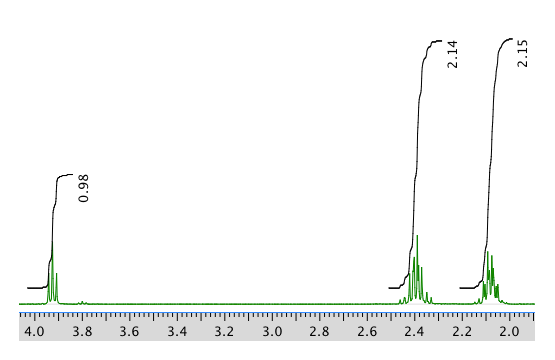
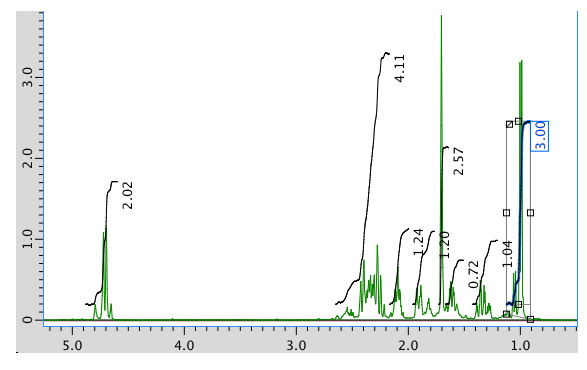
The full 1H NMR spectrum in D2O:
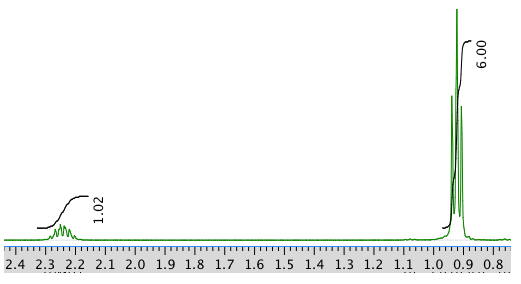
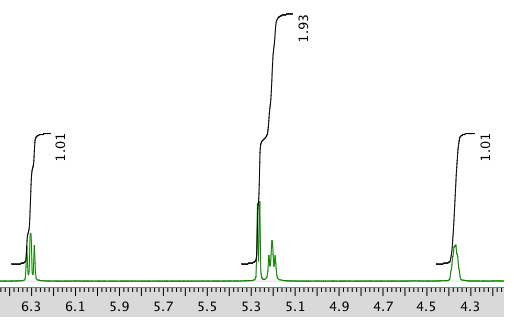
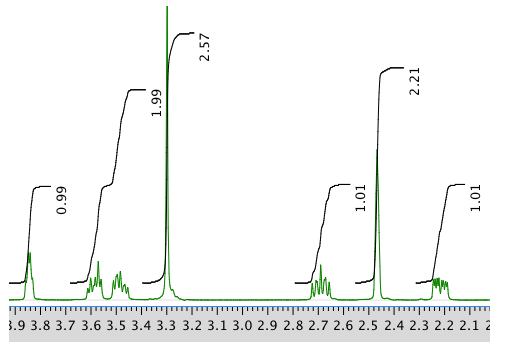
An expansion:
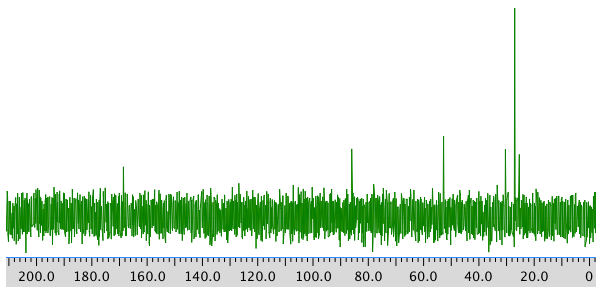
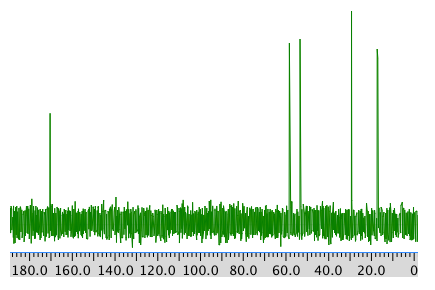
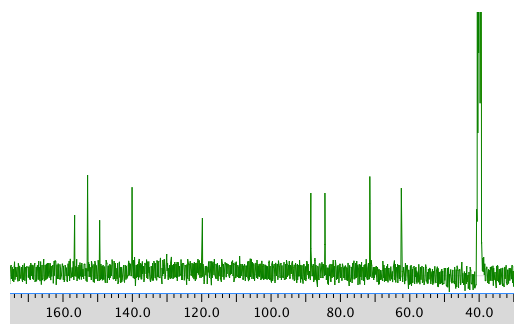
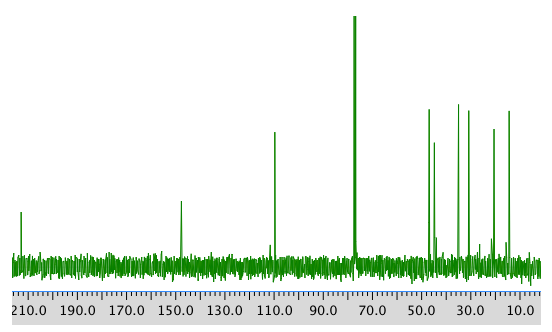
13C NMR:
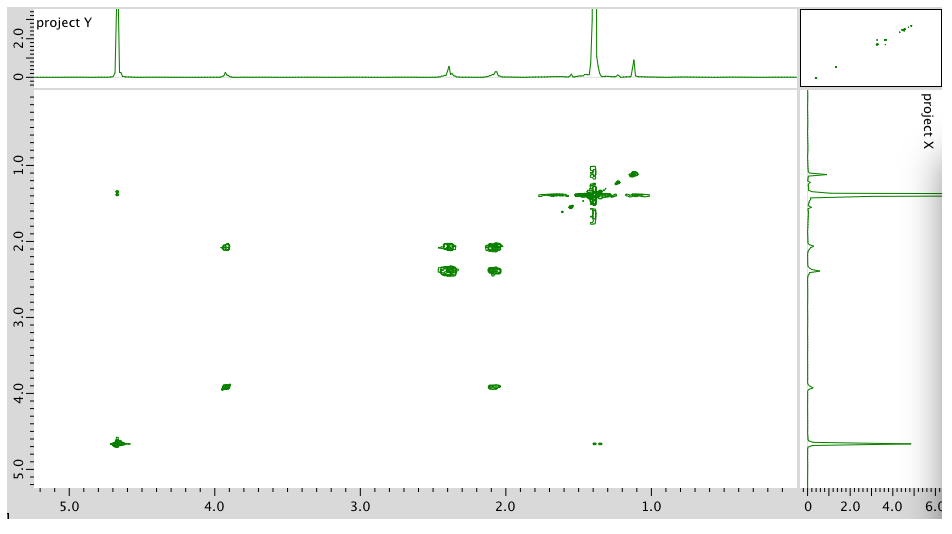
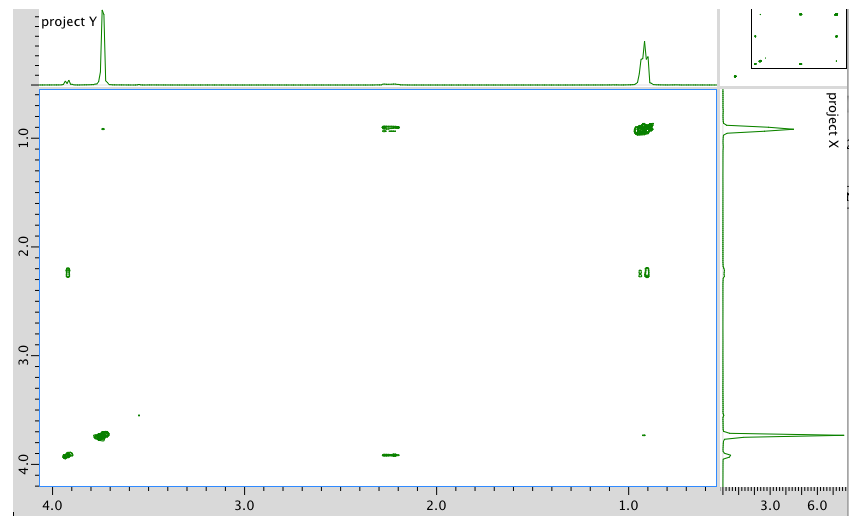
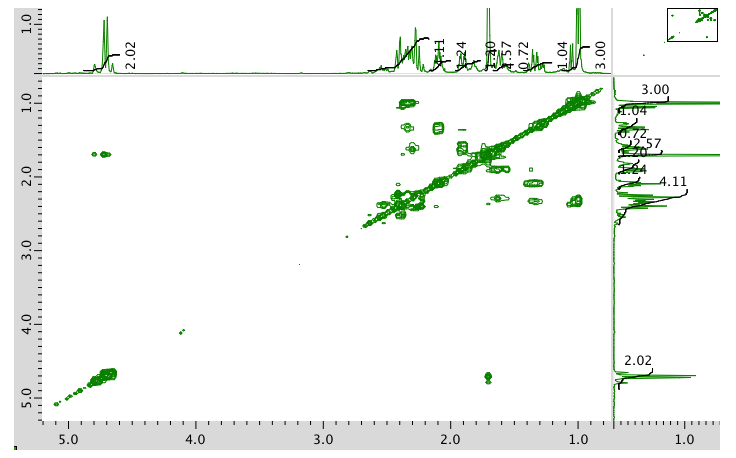
COSY:
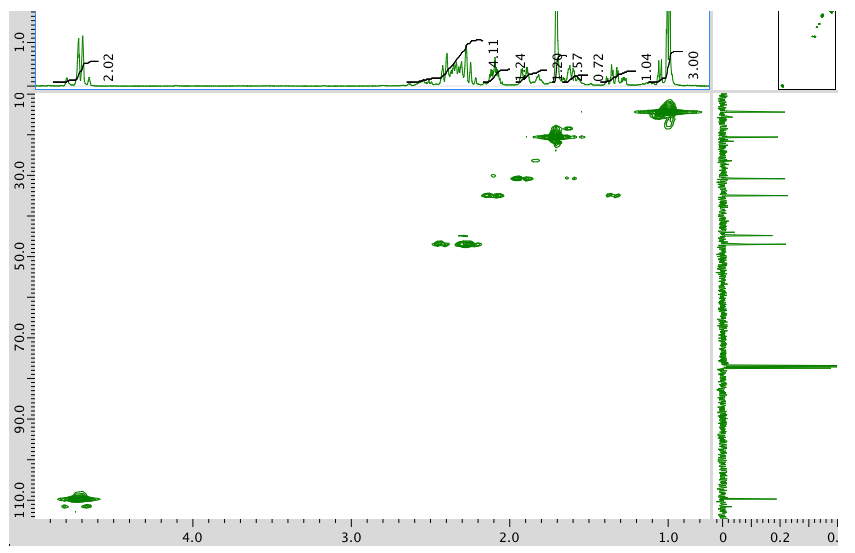
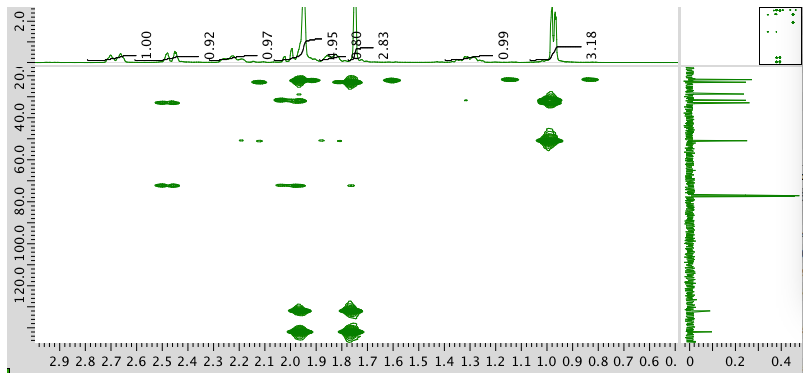
HMBC:
- Answer
-
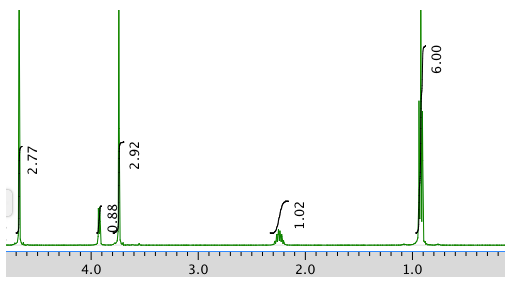
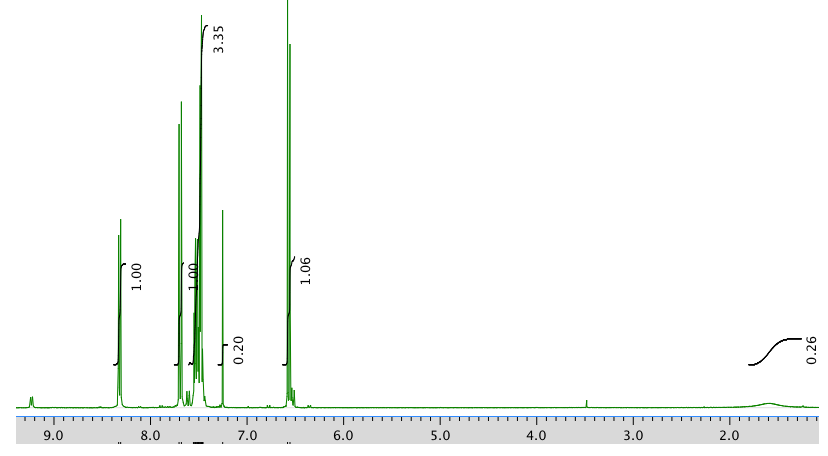
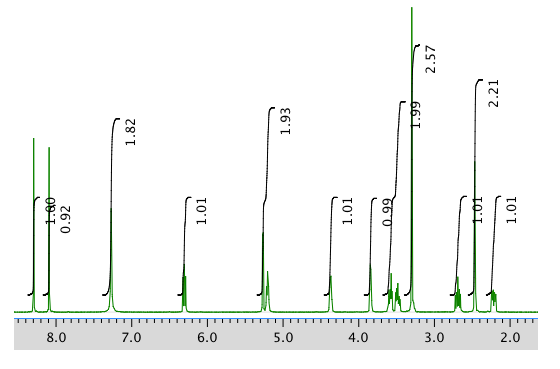
1H NMR:
Chemical shift (ppm)
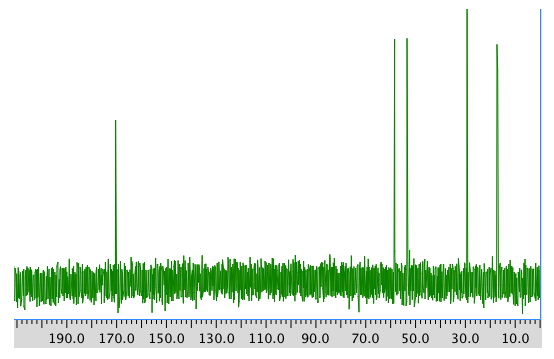
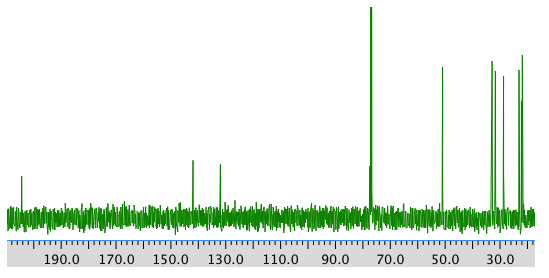
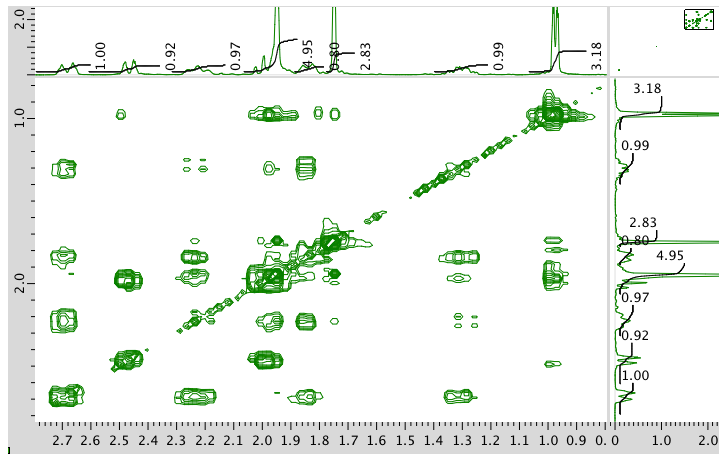
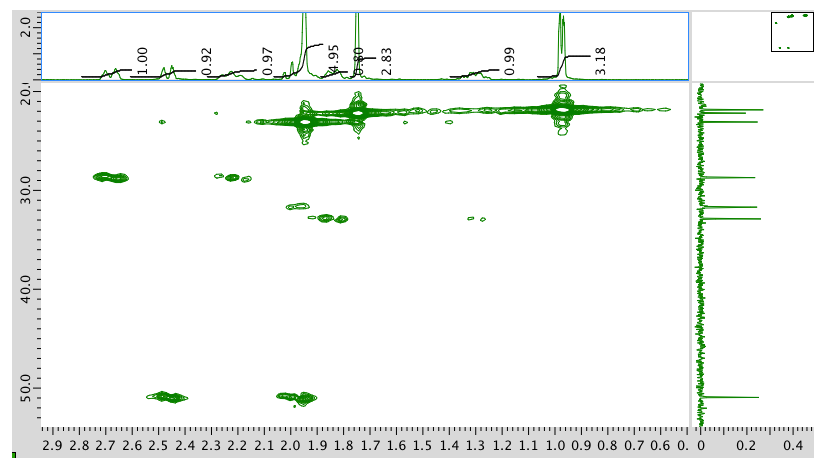
Integration Multiplicity Partial Structure 4.71 -- singlet solvent 4.17 1H doublet? CO-CH-N 3.75 3H singlet O-CH3 2.25 1H multiplet CH-CH-(CH3)2 0.92 6H triplet? 2 x CH3 13C NMR:
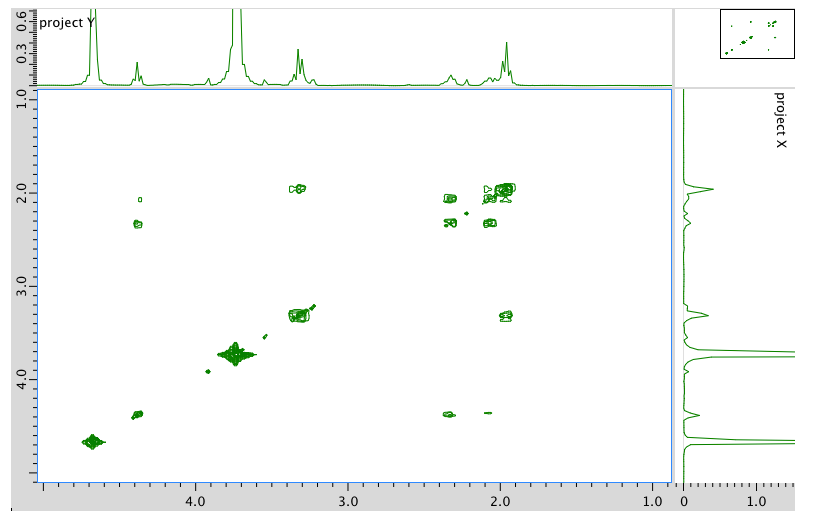
Chemical shift (ppm) Type of carbon 170 sp2 C=O 60 sp3 C-N 52 sp3 C-O 30 sp3 C 19 sp3 C COSY:
Assignment 1H COSY A 4.17 2.25 B 3.75 -- C 2.25 4.17 D 0.92 2.25 Formula:
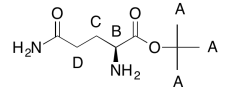
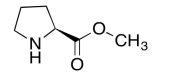
C6H13O2N (1 O indicated from shift in 13C, 1H NMR)
FW = \((6 \times 120 + (13 \times 1) + (2 \times 16) + (1 \times 14) = 131\)
Degrees of unsaturation = \(\frac{(2 \times 6) + 2 + 1 - 13}{2} = 1\) unit (1 double bond)
The data should be consistent with this structure:
Exercise \(\PageIndex{5}\)
Present an analysis of the following data and propose a structure.
MW: 144 amu
The 1H NMR spectrum in CDCl3:
An expansion of the 1H NMR spectrum:
13C NMR spectrum:
COSY:

An expansion of the COSY spectrum:
HMBC:
An expansion of the HMBC spectrum:
- Answer
-
Exercise \(\PageIndex{6}\)
Present an analysis of the following data and propose a structure.
MW: 164 amu
The full 1H NMR spectrum in CDCl3:
AN expansion:
13C NMR:
COSY:
Expansion of COSY spectrum:
- Answer
-
The data should be consistent with this structure:
Exercise \(\PageIndex{7}\)
Present an analysis of the following data and propose a structure.
MW: 129 amu
The full 1H NMR spectrum in D2O:
13C NMR spectrum:
COSY spectrum:
- Answer
-
The data should be consistent with this structure:
Exercise \(\PageIndex{8}\)
Present an analysis of the following data and propose a structure.
MW: 173 amu
The full 1H NMR spectrum in CDCl3:
An expansion of the 1H NMR spectrum:
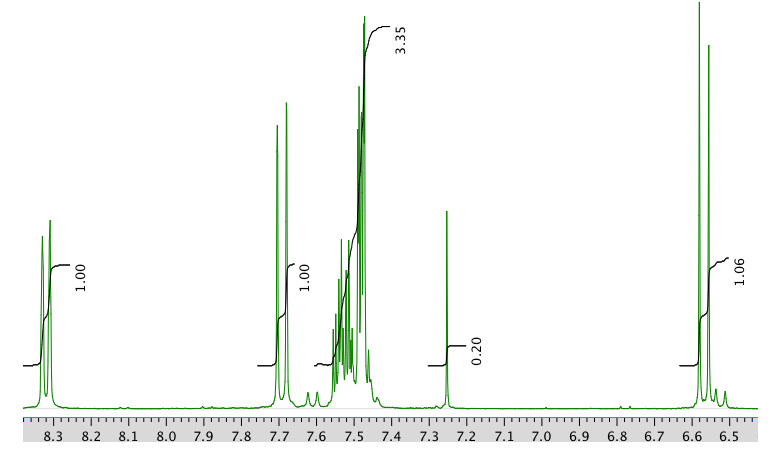
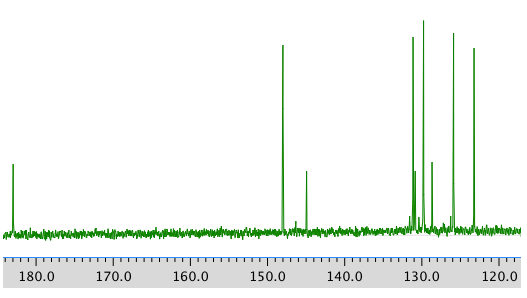
13C NMR spectrum:
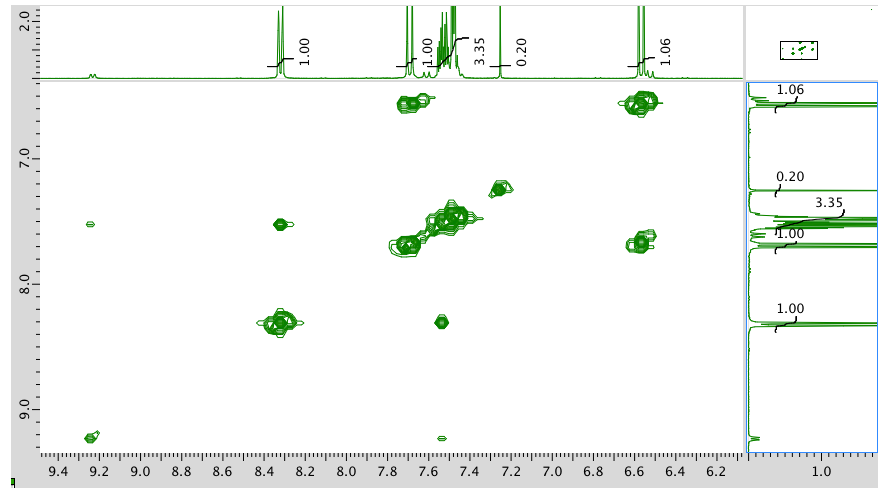
COSY:
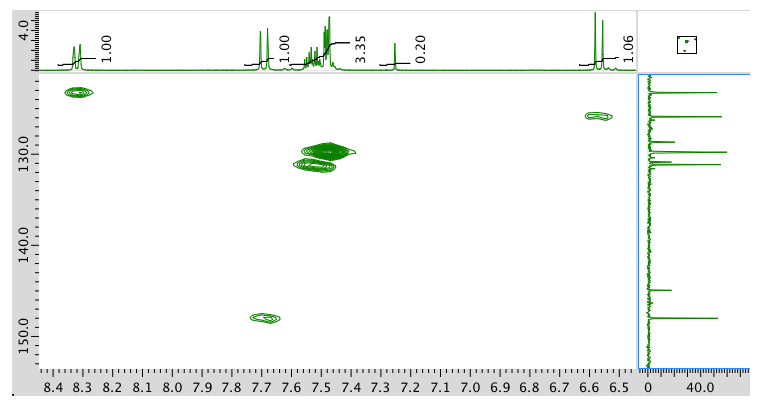
HMQC:
HMBC:
- Answer
-
The data should be consistent with this structure:
Exercise \(\PageIndex{9}\)
Present an analysis of the following data and propose a structure.
MW: 145 amu
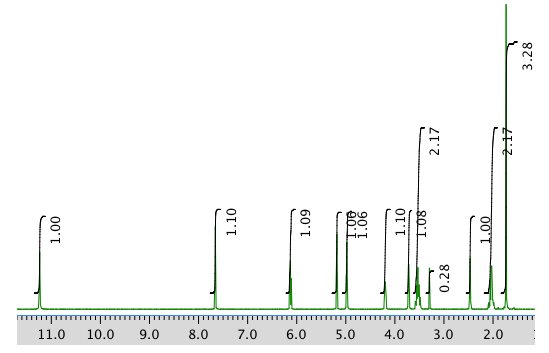
The full 1H NMR spectrum in D2O:
An expanded view of 1H NMR spectrum:
Another expanded view:
13C NMR spectrum:
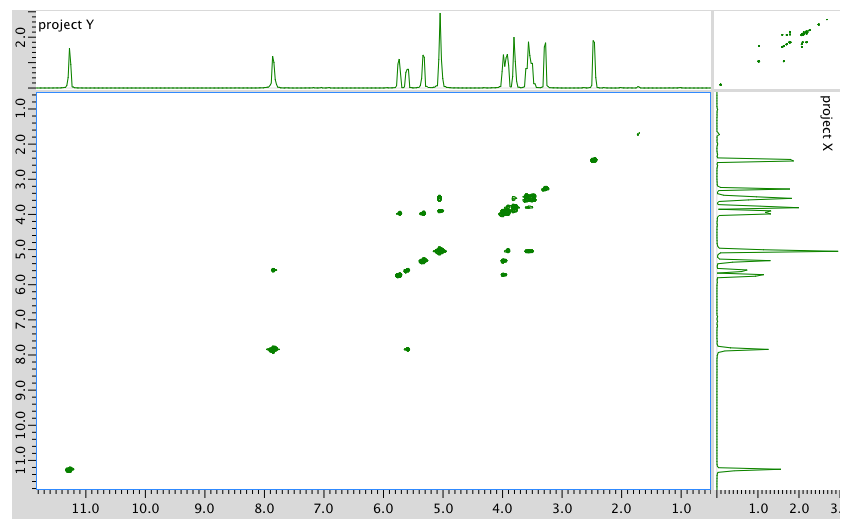
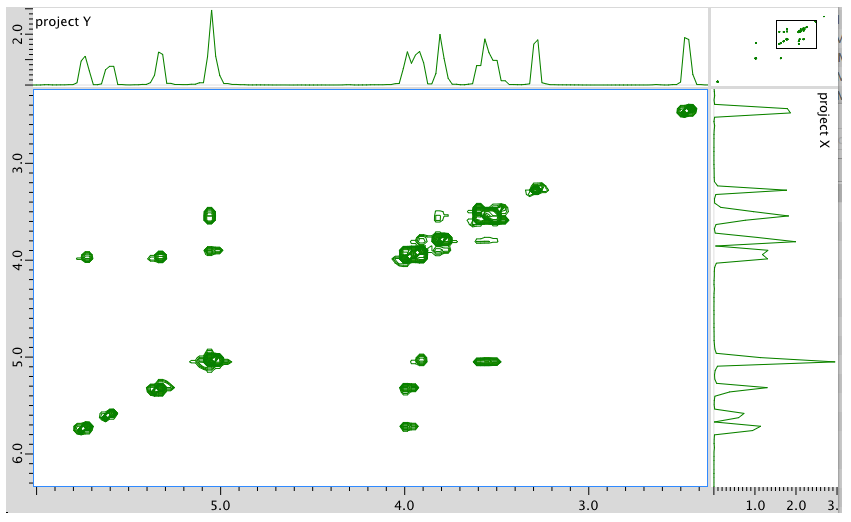
COSY spectrum:
- Answer
-
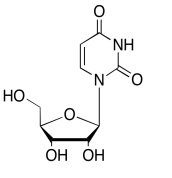
The data should be consistent with this structure:
Exercise \(\PageIndex{10}\)
Present an analysis of the following data and propose a structure.
MW: 251 amu
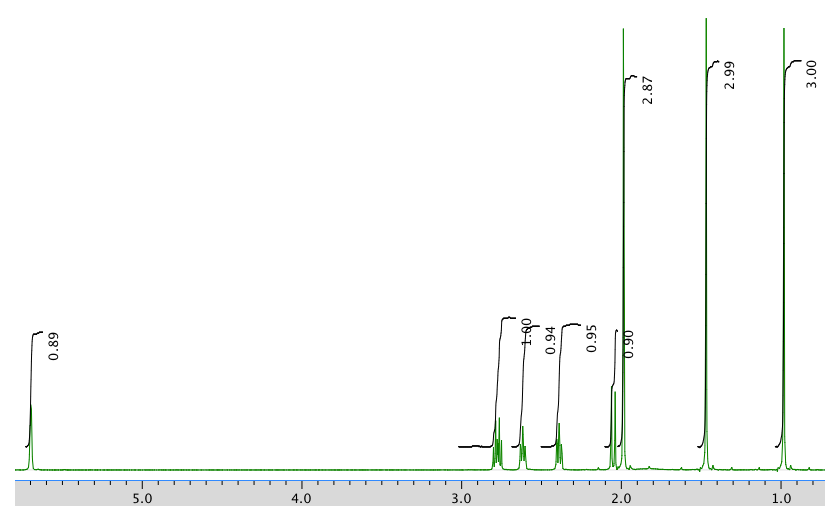
The full 1H NMR spectrum in DMSO-d6:
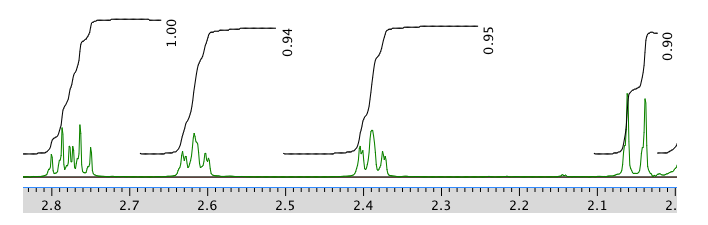
An expanded view of the 1H NMR spectrum:
Another expansion:
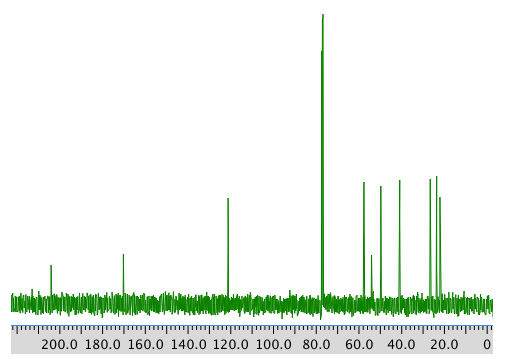
13C NMR spectrum:
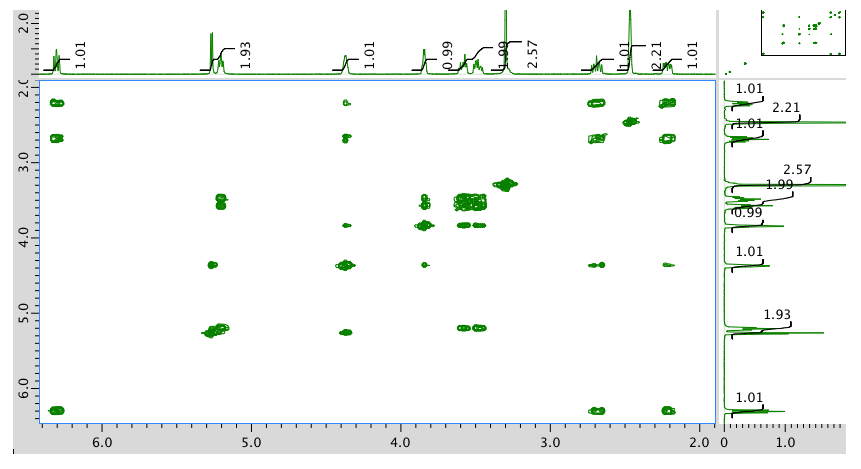
COSY spectrum:
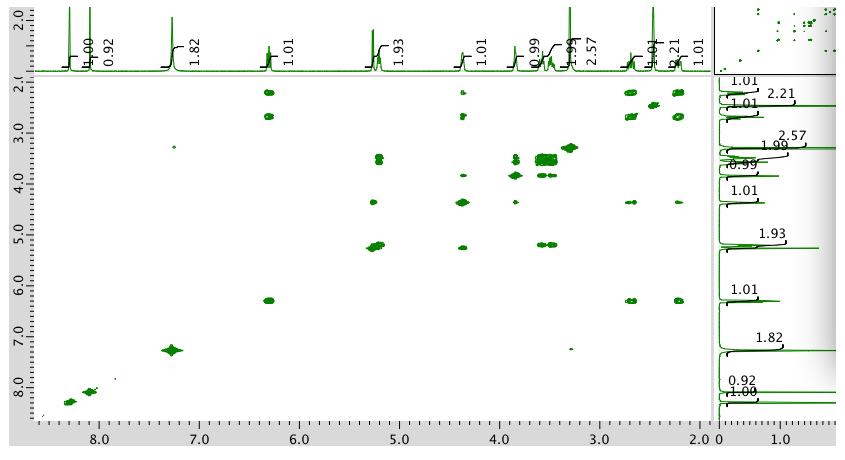
Expansion of COSY:
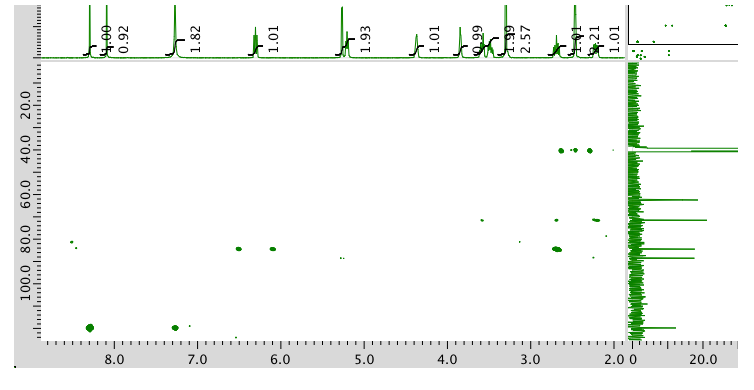
HMQC spectrum:
- Answer
-
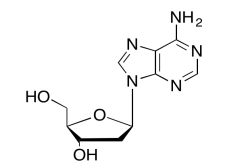
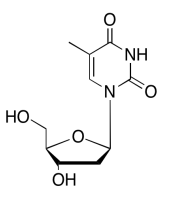
The data should be consistent with this structure:
Exercise \(\PageIndex{11}\)
Present an analysis of the following data and propose a structure.
MW: 244 amu
The full 1H NMR spectrum in DMSO-d6:
An expanded view of the 1H NMR spectrum:
Another expansion of the 1H NMR spectrum:
13C NMR spectrum:
COSY:
An expanded view of the COSY spectrum:
- Answer
-
The data should be consistent with this structure:
Exercise \(\PageIndex{12}\)
Present an analysis of the following data and propose a structure.
MW: 242 amu
The full 1H NMR spectrum in DMSO-d6:
Expansion of the 1H NMR spectrum:
Another expansion:

13C NMR spectrum:
COSY:
An expansion of the COSY spectrum:
- Answer
-
The data should be consistent with this structure:
Exercise \(\PageIndex{13}\)
Present an analysis of the following data and propose a structure.
MW: 152 amu
The full 1H NMR spectrum in CDCl3:
An expansion of the 1H NMR spectrum:
13C NMR spectrum in CDCl3:
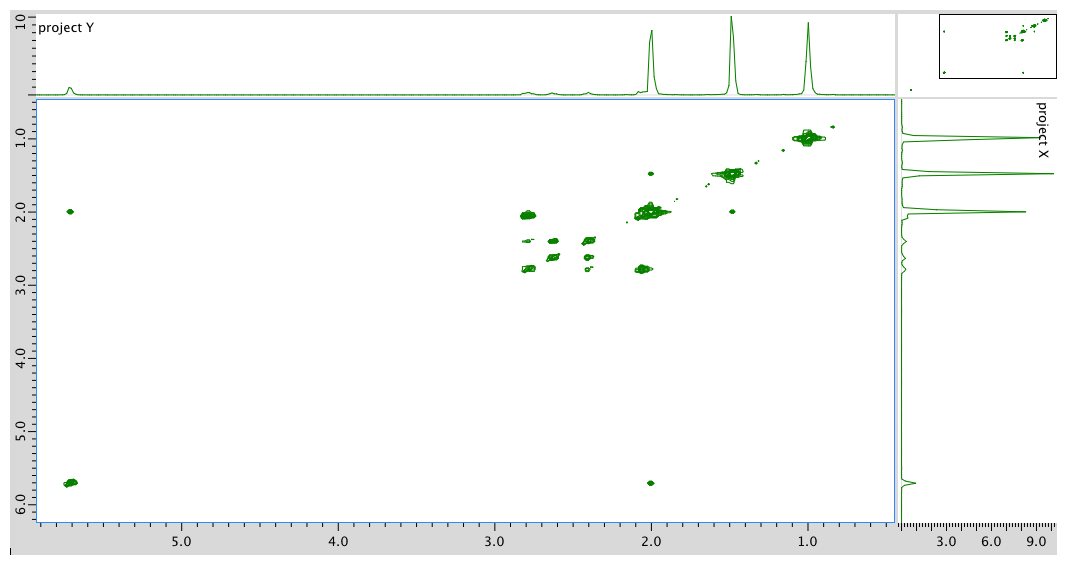
COSY spectrum:
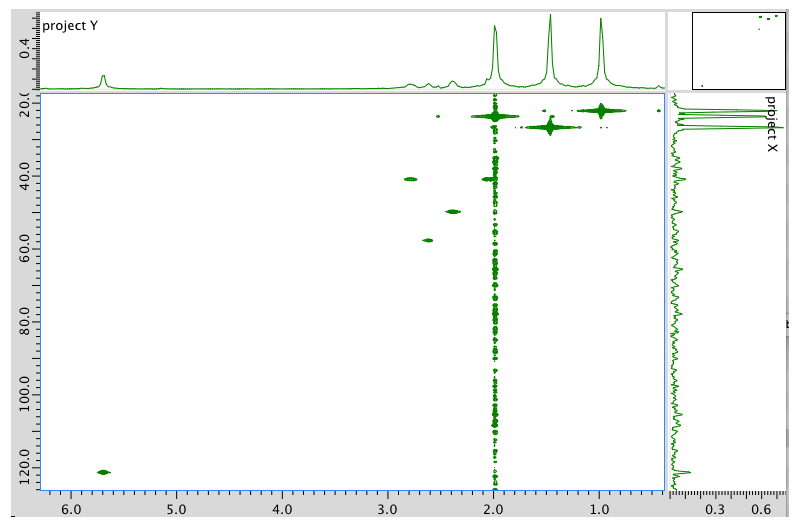
HMQC spectrum:
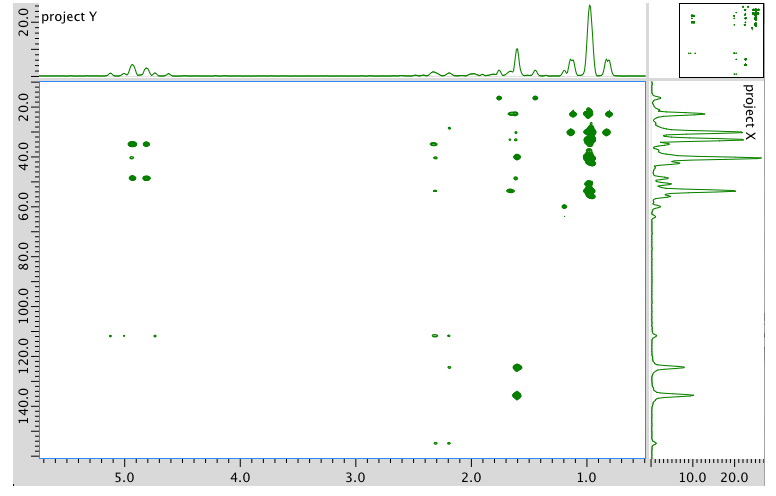
HMBC spectrum:
- Answer
-
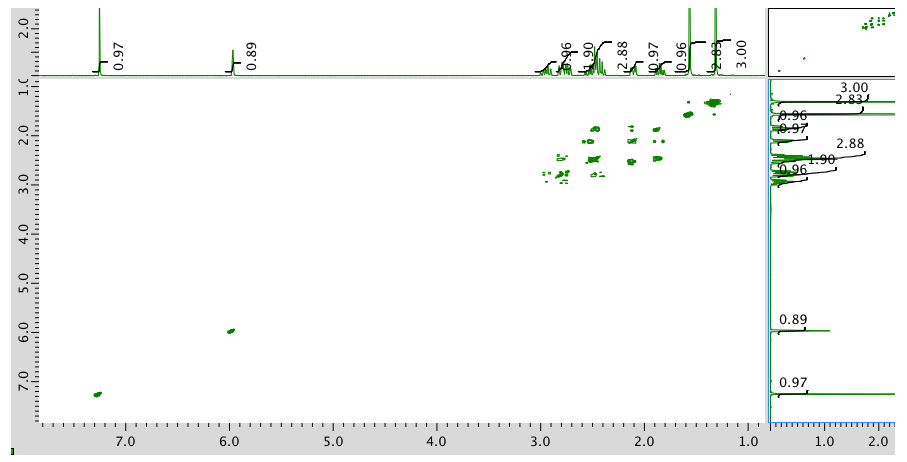
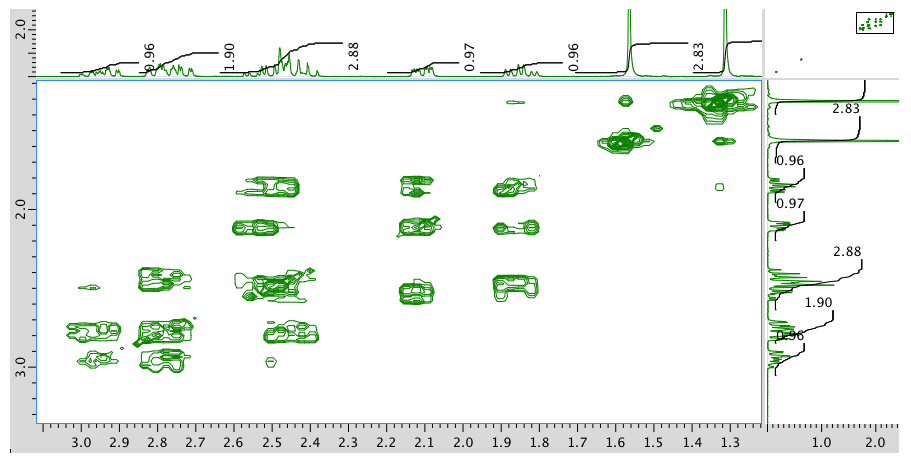
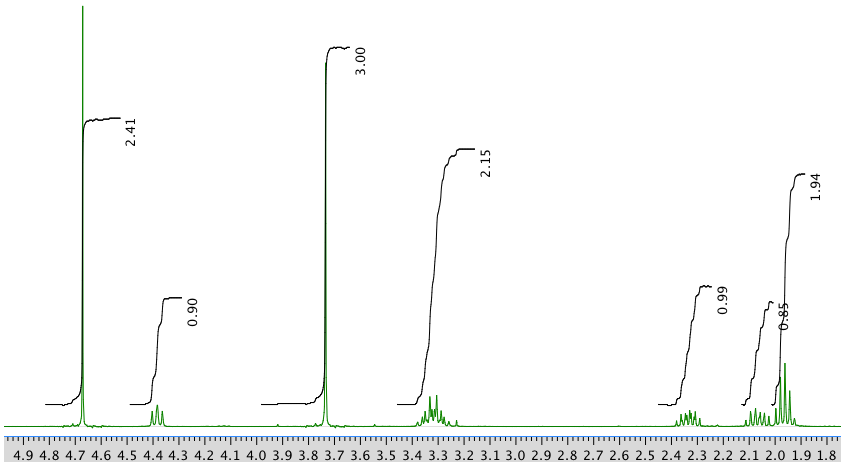
1H NMR:
Chemical shift (ppm) Integration Multiplicity Partial structure 5.7 1H singlet C=CH-CO 2.77 1H multiplet CH2-CH-CO 2.62 1H multiplet C-CH-C 2.39 1H multiplet C-CH-C 2.05 1H doublet? C-CH-CH? 1.96 3H singlet C-CH3 1.48 3H singlet C-CH3 0.98 3H singlet C-CH3 13C NMR:
Chemical shft (ppm) Type of carbon 204 sp2 C=O 170 sp2 121 sp2 59 sp3 55 sp3 50 sp3 41 sp3 28 sp3 24 sp3 22 sp3 COSY:
Assignment 1H COSY 1 2.39 2.77, 2.62? 3 5.7 2.05? 5 2.62 2.62? 7a 2.77 2.05 7b 2.05 2.77 8 1.48 -- 9 0.98 -- 10 1.96 -- Formula:
C10H14O (1 O indicated from shift in 13C, 1H NMR)
FW = \((10 \times 12) + (14 \times 1) + (1 \times 16) = 150 \)
Degrees of unsaturation = \(\frac{(2 \times 10) + 2 - 14}{2} = 4 units (e.g. 2 rings, 2 double bonds)
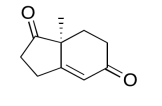
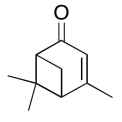
The data should be consistent with this structure:
Exercise \(\PageIndex{14}\)
Present an analysis of the following data and propose a structure.
MW: 152 amu
The full 1H NMR spectrum in CDCl3:
13C NMR spectrum:
COSY spectrum:
HMQC spectrum:
HMBC spectrum:
- Answer
-
The data should be consistent with this structure:
Exercise \(\PageIndex{15}\)
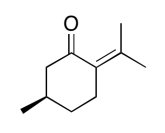
Present an analysis of the following data and propose a structure.
MW: 150 amu
The full 1H NMR spectrum in CDCl3:
An expansion of the 1H NMR spectrum:
13C NMR spectrum:
COSY spectrum:
HMQC spectrum:
HMBC spectrum:
- Answer
-
The data should be consistent with this structure:
NMR spectra obtained on a JEOL 400 MHz NMR spectrometer.