
4.19: Appendix
- Page ID
- 194913

Table of 13C NMR Frequencies Common in Organic Compounds.
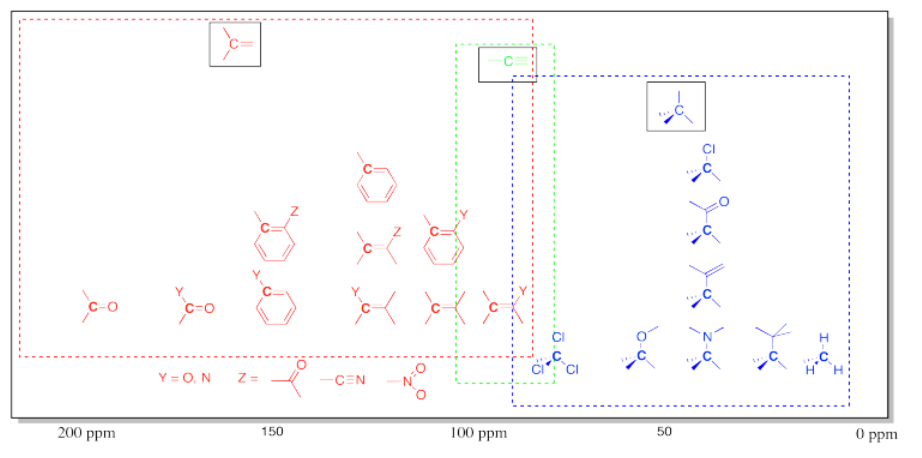
Note that effects are additive: two or more electron-withdrawing groups move the absorbance further to the left than just one group.
Table of 1H NMR Frequencies Common in Organic Compounds.
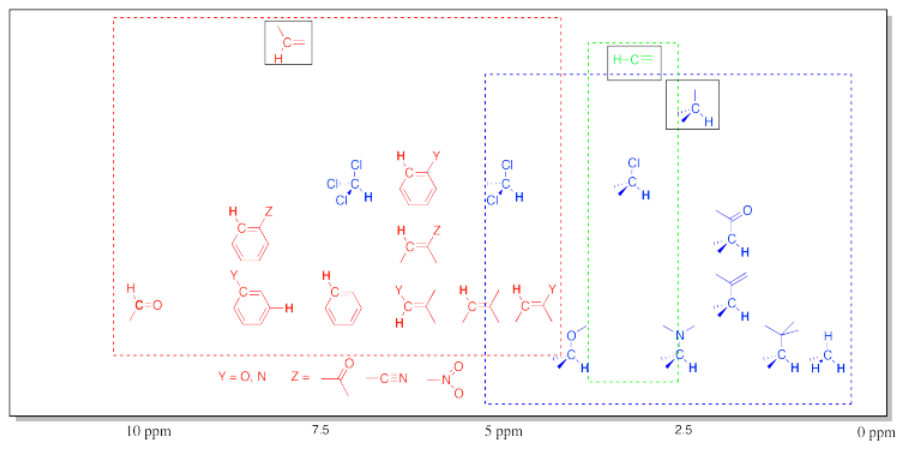
This chart shows the frequancies of protons that are attached to carbons. In general, protons follow the trend seen in the carbon to which they are attached. Note again the additive effects of multiple attached groups.
This table does not include OH (or NH) protons. Protons attached to heteroatoms are more difficult to pinpoint because their locations in the spectrum are much less specific. Instead, they may be found across a very broad range.
Table of 1H NMR Frequencies of OH Common in Organic Compounds.
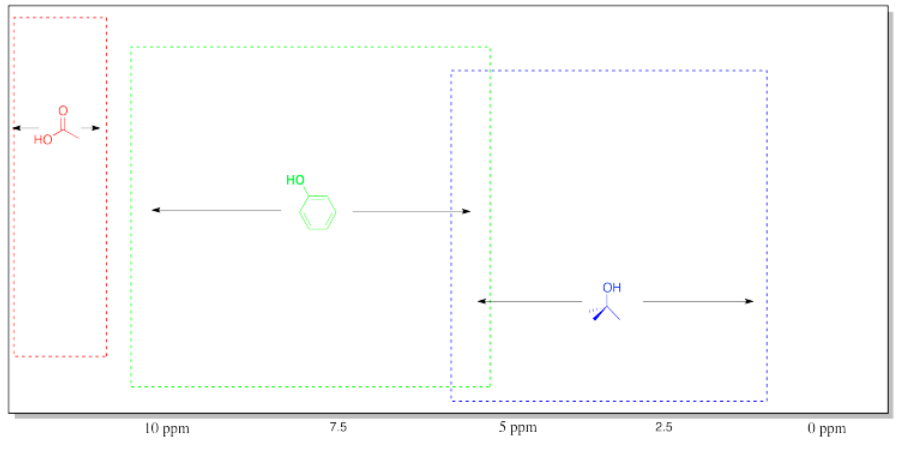
Table of Some Common Impurities in NMR Samples.
Minor impurities in the NMR spectrum are often the result of solvents used during a reaction or sample purification. A few examples are provided in the following table, showing the data you would see from common solvents in an NMR spectrum taken in chloroform.
| solvent | number of peaks | shift | multiplicity | integral ratio | assignment |
| water | 1 | 1.56 | br. s | - | O-H |
| acetone | 1 | 2.17 | s | - | (C=O)CH3 |
| chloroform | 1 | 7.26 | s | - | Cl3C-H |
| t-butyl methyl ether | 2 | 1.19 | s | 3 | C(CH3)3 |
| 3.22 | s | 1 | O-CH3 | ||
| ethyl acetate | 3 | 1.26 | t | 3 | CH2CH3 |
| 2.05 | s | 3 | (C=O)CH3 | ||
| 4.12 | q | 2 | OCH2CH3 | ||
| grease or alkanes | 2 | 0.86 | m | varies; smaller | CH2CH3 |
| 1.26 | m | varies; larger | CH2CH2CH2 / CH2CH2CH3 |
An excellent table, including shifts of a variety of impurities in different NMR solvents, can be found in the following article: Gottlieb, H. E.; Kotlyar, V.; Nudelman, A. J. Org. Chem. 1997, 62, 7512-7515.
Table of Solvent
Residual Peaks
Because an NMR sample is mostly solvent (with a small amount of dissolved solute that you are really interested in), there is usually a peak in the spectrum that comes from atoms in the solvent. Usually the use of deuterated solvents (enriched in 2H instead of 1H) minimizes the size of solvent peaks in 1H NMR. However, there is always a trace of 1H left in the solvent, which shows up as a small peak in the spectrum. 13C residual peaks are often much larger than the peaks arising from the solute.
| Solvent | 1H Shift | Multiplicity | 13C Shift | Multiplicity* |
| Acetone-d6 | 2.05 | pent | 206.68 | sing |
| 29.92 | sept | |||
| Acetonitrile-d3 | 1.94 | pent | 118.69 | sing |
| 1.39 | sept | |||
| Benzene-d6 | 7.16 | sing | 128.39 | trip |
| Chloroform-d | 7.27 | sing | 77.23 | trip |
| D2O | 4.80 | -- | ||
| Dichloromethane-d2 | 5.32 | trip | 54.00 | pent |
| DMF-d7 | 8.03 | sing | 163.15 | trip |
| 2.92 | pent | 34.89 | sept | |
| 2.75 | pent | 29.76 | sept | |
| DMSO-d6 | 2.50 | pent | 39.51 | sept |
| Methanol-d4 | 4.87 | sing | 49.15 | sept |
| 3.31 | pent | |||
| THF-d8 | 3.58 | sing | 67.57 | pent |
| 1.73 | sing | 25.37 | sing |
*Note that coupling to 2H produces different patterns than coupling to 1H.