4.4: Factors in Chemical Shift- Carbon Geometry
- Page ID
- 189771

As in IR spectroscopy, the frequency at which different carbons absorb in the NMR spectrum is pretty predictable. There are two main factors that control the shift. These two factors are :
- the geometry around the carbon atom.
- the electronegativity of the other atoms attached to the carbon.
First we'll look at the influence of geometry.
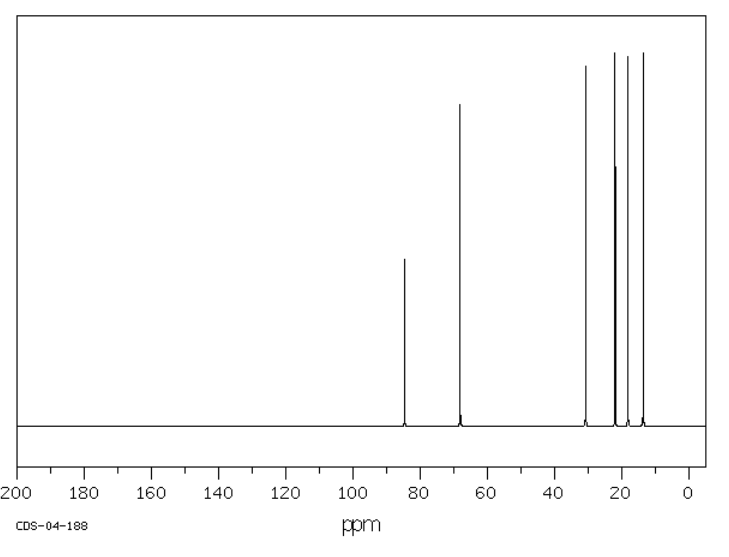
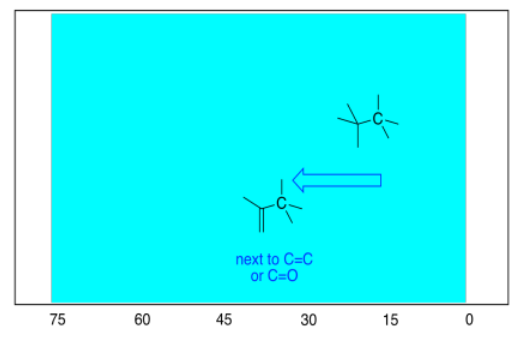
In all of the hydrocarbon spectra seen above, the only peaks observed are at the right-hand end of the spectrum. The 13C spectrum ranges from about 0 ppm to about 200 ppm, and all of the peaks we observed were well below 100 ppm. One of the things that those compounds had in common (cyclohexane, butane, pentane) was that they contain only tetrahedral (or sp3) carbons. And, in fact, that kind of carbon atom generally shows up below 100 ppm (typically below 80 ppm) in the 13C spectrum.
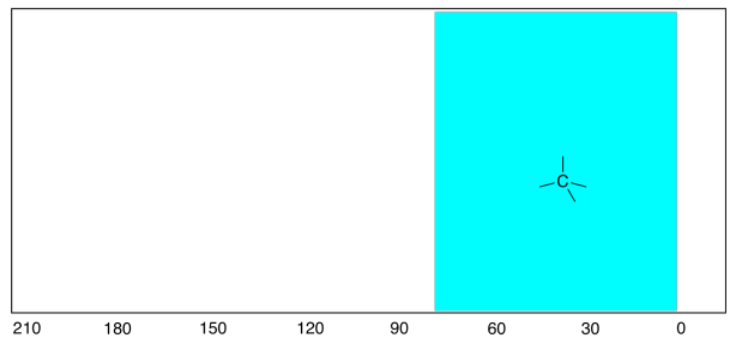
That's an important trend to know, because tetrahedral carbons are quite common in nature. Another shape of carbon atom, trigonal planar, is also pretty common. In contrast to the tetrahedral carbons, these carbons show up in the left-hand half of the spectrum, between 100 and 200 ppm.
As a general rule:
- sp2 or trigonal planar carbons absorb in the left half of the spectrum (100 - 200 ppm).
- sp3 or tetrahedral carbons absorb in the right half of the spectrum (0 - 100 ppm).
In the 13C NMR spectrum of another hydrocarbon, 1-hexene, most of the peaks show up at the right-hand end, but two others show up farther to the left. A comparison of the structures will tell you that these two peaks are from the double-bonded carbons.
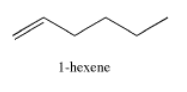
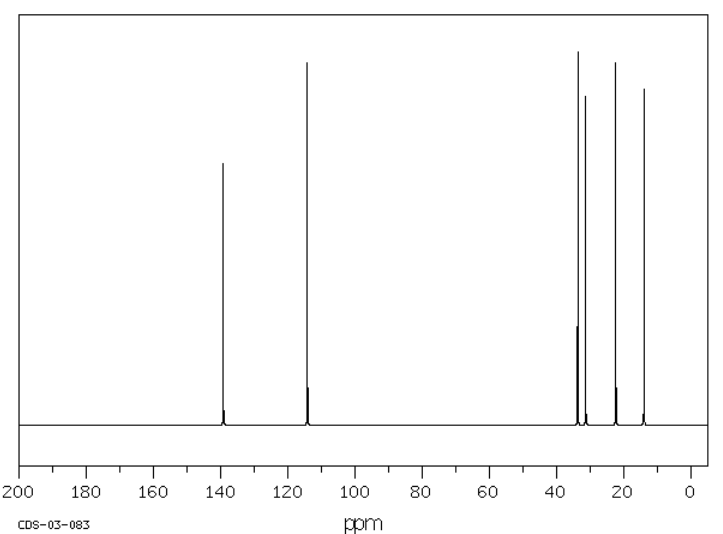
The alkene, 1-hexene, shows four peaks below 20 ppm and two near 100 ppm. The two carbons that absorb near 100 ppm are the two trigonal carbons that form the alkene functional group; the others are tetrahedral carbons.
Remember, a general rule means that there will be exceptions. You might see sp2 carbons at 210 ppm or 95 ppm, for example. You are not likely to see them at 30 ppm, however.
There are some more subtle factors that influence the shift of a carbon atom in the spectrum, having to do with what the neighbouring groups are in the compound. For example, a tetrahedral carbon shifts a little bit downfield if it is next to a trigonal planar carbon. The reason has to do with the way the magnetic field that is used in this experiment recruits the electrons of double bonds, essentially magnetizing them, as well.
The same thing happens if trigonal planar carbons are near other trigonal planar carbons. Just as in the tetrahedral case, these sp2 carbons can be pulled to the left under the influence of neighbouring double bonds. As a result, carbons in benzene rings show up slightly to the left of carbons in alkenes.
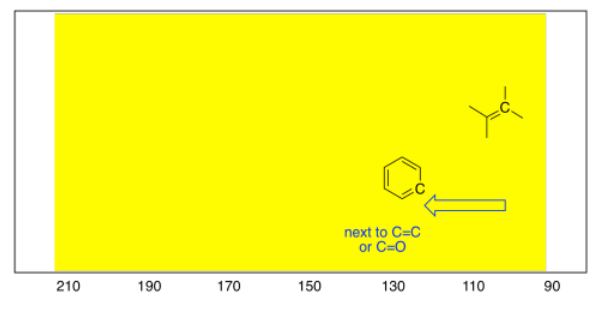
- sp2 carbons in alkenes show up near the upfield end of the sp2 half of the spectrum (usually around 100-120 ppm).
- sp2 carbons in aromatic systems like benzene absorb a little farther downfield than alkenes (around 120-160 ppm).
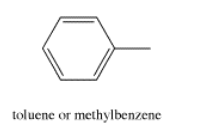
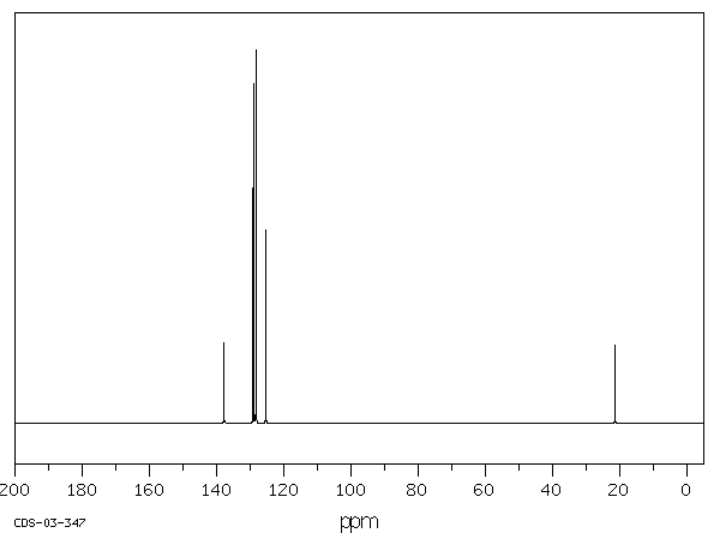
Another compound that contains both sp2 and sp3 carbons is toluene or methylbenzene. Its 13C NMR spectrum shows one peak near 30 ppm and four between 120 and 130 ppm.
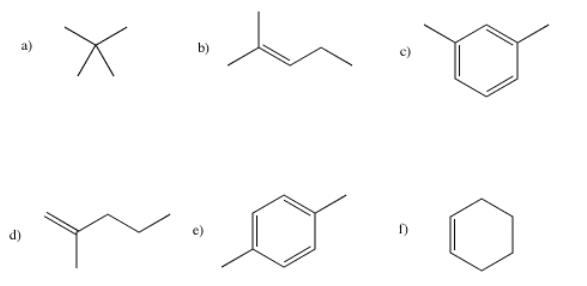
Draw an approximate 13C NMR spectrum for each of the following compounds. You will need to take into account symmetry and carbon geometry.
- Answer
-

Determine whether the following peaks represent sp2 (trigonal planar) or sp3 (tetrahedral) carbon atoms.
a) 27 ppm b) 198 ppm c) 112 ppm d) 15 ppm e) 79 ppm f) 164 ppm
- Answer
-
a) sp3 b) sp2 c) sp2 d) sp3 e) sp3 f) sp2
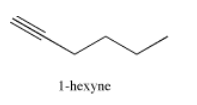
In addition, there are also linear carbons in organic chemistry, although they are much less common as tetrahedral and trigonal carbons. Linear or sp carbons absorb at about 60 to 100 ppm, sort of in the middle of the spectrum. Mostly they are seen around 60-80 ppm, so they overlap considerably with sp3 carbons.
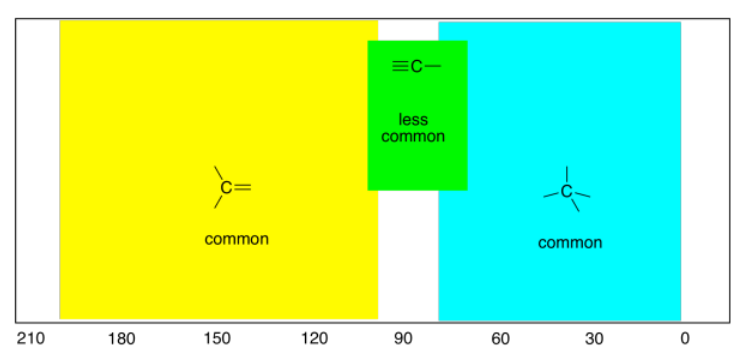
- sp or linear carbons absorb around 60-100 ppm.
- clearly, some sp3 carbons absorb at frequencies similar to sp carbons. Be careful.
One example of a compound containing sp carbons is 1-hexyne. Its spectrum is shown below.