
6.1: Introduction to Mass Spectrometry
- Page ID
- 189782

Through mass spectrometry we can learn the molecular mass of a compound (more commonly called the molecular weight). Knowing the molecular weight helps us to determine a structure by limiting the possibilities for the molecular formula.
Individual molecules often fall apart during the mass spectrometry experiment. As a result, in addition to measuring the mass of an entire molecule, we also obtain the weights of various smaller pieces of the molecule. That may add some confusion to the data. However, these fragments provide an idea about what parts make up the whole molecule.
A mass spectrum of hexane (molecular weight 86) illustrates what the data looks like.
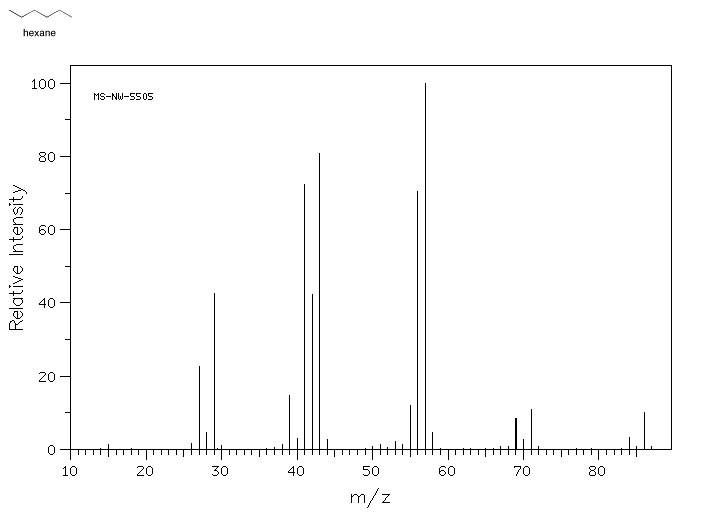
Source: SDBSWeb : http://riodb01.ibase.aist.go.jp/sdbs/ (National Institute of Advanced Industrial Science and Technology of Japan, 22 August 2008)
- The y-axis is usually labeled "abundance" or "relative intensity". This axis shows how the relative ratios of molecules in the sample that have a particular mass.
- The x-axis is labeled "m/z" and corresponds to molecular mass. The designation m/z refers to the fact that this technique really measures the ratio of an ion's mass to its charge.
- A mass spectrum does not show the results from one molecule, but from millions of molecules. Because it is displaying results for a population of molecules, more than one mass is shown
- Many of the molecules in the sample fall apart during the experiment.
- A mass spectrum is a bar graph showing the weights of entire molecules as well as smaller pieces of molecules. The entire molecule must have the largest mass, the one farthest to the right, because if a molecule falls into pieces the pieces would be smaller than the whole.
The following figure shows the mass spectrum of a saturated hydrocarbon (containing only carbon and hydrogen with only single bonds between carbons, not double bonds).
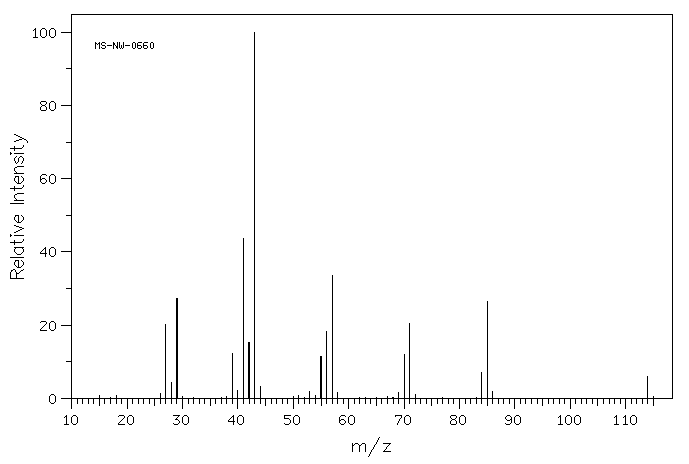
- Draw five different structures that would have the molecular weight of this compound.
- Choose four smaller m/z values from the spectrum and draw one structure for each of them. Note that these fragments will not have complete Lewis structures.