
4.15: NMR in Lab- Composition of Mixtures
- Page ID
- 194888

There will be cases in which you already know what the structure might be. In these cases:
- You should draw attention to pieces of data that most strongly support your expected structure. This approach will demonstrate evaluative understanding of the data; that means you can look at data and decide what parts are more crucial than others.
- You should also draw attention to negative results: that is, peaks that might be there if this spectrum matched another, possible structure, but that are in fact missing.
One of the most complicated problems to deal with is the analysis of a mixture. This situation is not uncommon when students run reactions in lab and analyse the data.
- Sometimes the spectra show a little starting material mixed in with the product.
- Sometimes solvents show up in the spectrum.
- As you might expect, the minor component usually shows up as smaller peaks in the spectrum. If there are fewer molecules present, then there are usually fewer protons to absorb in the spectrum.
- In this case, you should probably make two completely separate sets of data tables for your analysis, one for each compound, or else one for the main compound and one for impurities.
Remember that integration ratios are really only meaningful within a single compound. If your NMR sample contains some benzene (C6H6) and some acetone (CH3COCH3), and there is a peak at 7.15 that integrates to 1 proton and a peak at 2.10 ppm integrating to 6 protons, it might mean there are 6 protons in acetone and 1 in benzene, but you can tell that isn't true by looking at the structure.
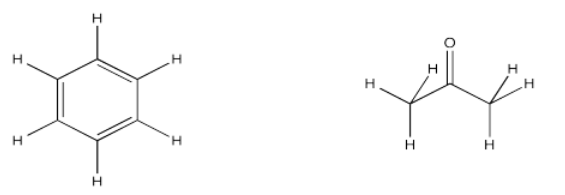
There are six protons in the benzene, and they should all show up near 7 ppm. There are six protons in acetone, and they should all show up near 2 ppm. If there were 1 molecule of benzene for every molecule of acetone, then the integrations would be equal.
Assuming that small integral of 1H for the benzene is really supposed to be 6H, then the large integral of 6H for the acetone must also represent six times as many hydrogens, too. It would be 36 H. There are only six hydrogens in acetone, so it must represent six times as many acetone molecules as there are benzenes.
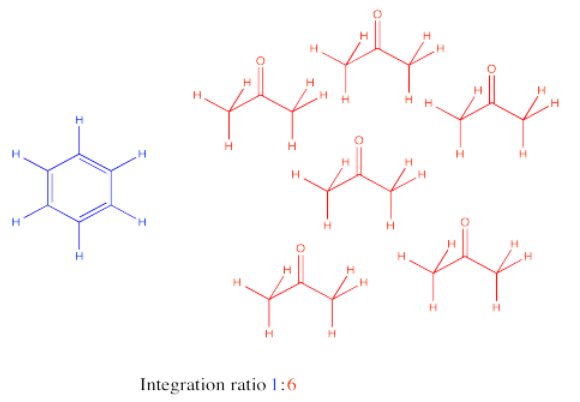
In general, to calculate that ratio, we have to take the integral we see and correct for the number of hydrogens it is supposed to represent. If there are six hydrogens per molecule, and we divide the integral by six, then the result represents the relative amount of that molecule in the sample.
For benzene: at 7.15 ppm, integral = 1H
But 1H / 6H per molecule = 0.17 molecules
For acetone: at 2.10 ppm, integral = 6H
But 6H / 6H per molecule = 1 molecule
The ratio of acetone to benzene = 1 molecule acetone : 0.17 molecules benzene = 6 acetone : 1 benzene
Sometimes a compound will have several peaks in an NMR spectrum because it has several unique hydrogens. For example, ethyl acetate has a few different peaks. What if you wanted to compare the amount of acetone to the amount of water?
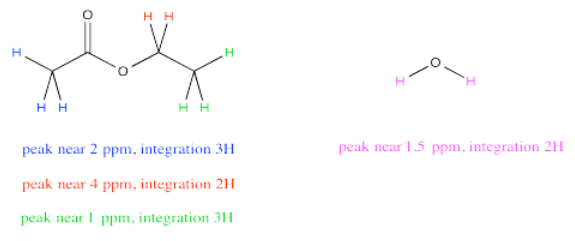
It might be tempting to just measure up all the integrals for the hydrogens in ethyl acetate and all the integrals for the hydrogens in water. Comparing those two numbers would tell you the ratio of ethyl acetate to water, right? Not exactly. Ethyl acetate has a lot more protons than water, so that isn't a fair comparison. Even in a 1:1 misture of water to ethyl acetate, the total integral for ethyl acetate should be much bigger than for water.
However, notice that peak near 4 ppm in ethyl acetate. It represents 2H, just like the peak for water. Comparing the integral for the peak at 4 to the integral for the peak at 1.5 would provide a pretty good ratio of ethyl acetate to water. The reason we choose the integral at 4 ppm is because it isn't close to any other peaks, so we are very confident that this integral represents only ethyl acetate and nothing else.
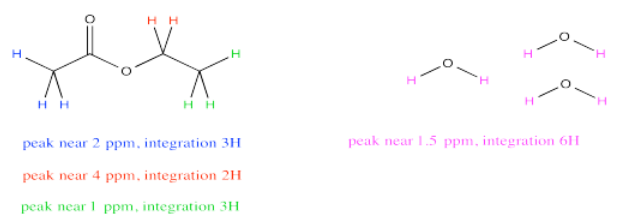
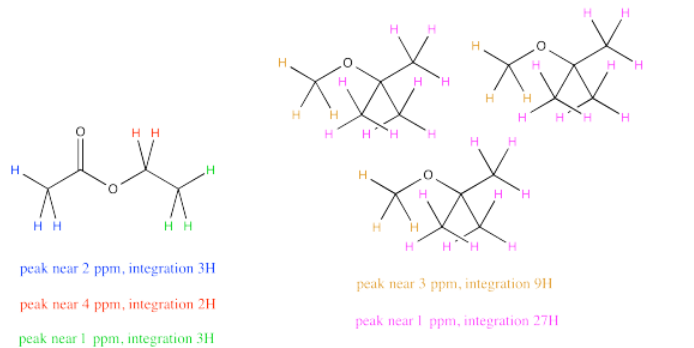
Because both peaks represent the same number of hydrogens, the integrals give a direct ratio of the number of molecules present. So, suppose the spectrum reports a raw integral of 27 for the peak at 1.5 ppm and 9 for the peak at 4 ppm. Remember, the integral is just reporting the relative area under the peak, rather than some absolute quantity, so the initial numbers we get might not sound like they correspond to a reasonable number of hydrogens. It's the ratio that matters, and the ratio of 27:9 is 3. If the integral at 1.5 ppm is three times bigger than the one at 4 ppm, there must be three times as many water molecules as ethyl acetate molecules.
For water: at 1.5 ppm, integral = 27H
But 27H / 2H per molecule = 13.5 molecules
For ethyl acetate: at 4.2 ppm, integral = 9H
But 9H / 2H per molecule = 4.5 molecule
The ratio of water to ethyl acetate = 13.5 molecule water : 4.5 molecules ethyl acetate = 3 water : 1 ethyl acetate
Sometimes there are several unique hydrogens in both compounds that you want to compare, so you will need to make a choice about which peaks to compare. For example, maybe you need to determine the ratio of ethyl acetate to TBME (tert-butyl methyl ether, sometimes alternatively called MTBE) in a sample.
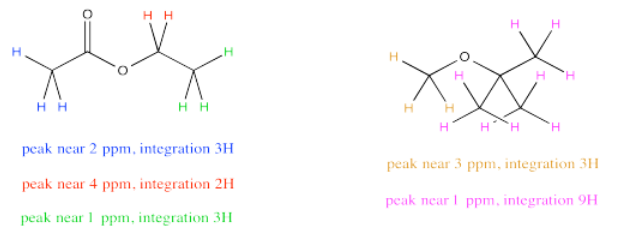
The easiest thing to do may be to compare the peak at 2 ppm in ethyl acetate with the peak at 3 ppm in TBME. They are both supposed to be 3H, so a comparison of those two integrals gives you a direct look at the ratio of molecules. For example, a 1:3 ratio between the peak at 2 ppm and the peak at 3 ppm would indicate a 1:3 ratio of molecules.
But what if, right before you made your NMR sample, you noticed a little schmutz on the NMR tube and decided to clean it with some acetone. As a result, you're pretty sure there is some acetone in your NMR sample. Unfortunately, that also shows up at 2 ppm, so you're not quite sure what part of the integral at 2 ppm is telling you about the acetone and what part is telling you about the ethyl acetate.
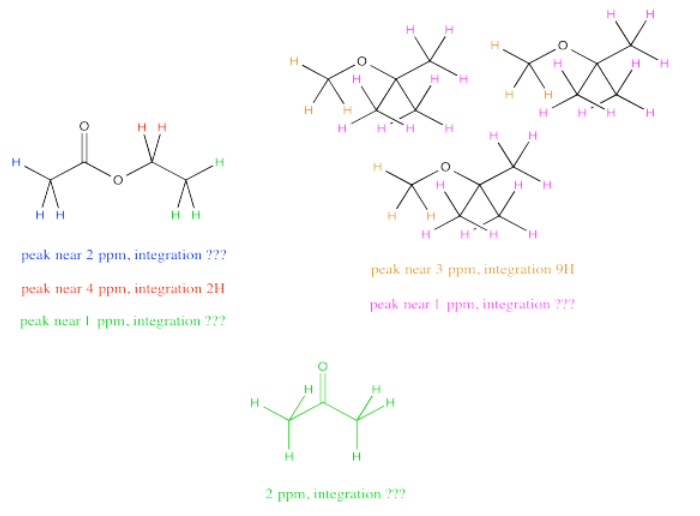
Don't worry. You can still resort to comparing the peak at 4 ppm in ethyl acetate, which you can see very clearly, with the peak at 3 ppm in TBME, also in the clear. The only trouble is that you have to take into account that one peak represents 2H per molecule and the other peak represents 3H per molecule. You need to adjust for that by, for example, multiplying the integral at 3 ppm by 2/3. You're cutting it down so you can compare it to a peak that would only represent 2H rather than 3H. You are putting it on an equal footing with the peak from the ethyl acetate, so that you can compare the number of molecules present, not just the number of H in each molecule.
Suppose this students measures those two raw integrals at 4 ppm and 3 ppm, and gets values of 127H and 38H.
For ethyl acetate: at 4.2 ppm, integral = 127H
But 127H / 2H per molecule = 63.5 molecules
For TBME: at 3.10 ppm, integral = 38H
But 38H / 3H per molecule = 12.67 molecule
The ratio of ethyl acetate to TBME = 63.5 molecule ethyl acetate : 12.67 molecules TBME = 5 ethyl acetate : 1 TBME
Sometimes, you may be asked to express the make-up of the sample in terms of percent composition rather than as a ratio. Converting ratios to percentages involves dividing one part of the ratio by the sum of both parts.
% ethyl acetate = \(\frac{5}{5+1} \times 100 \% = 83.3\%\) ethyl acetate
% TBME = \(\frac{1}{5+1} \times 100 \% = 16.7 \%\) TBME
or %TBME = \(100 - 83.3 \% = 16.7 \%\)
If you have decided that you can identify two sets of peaks in the 1H spectrum, analysing them in different tables makes it easy to keep the integration analysis completely separate too ; 1 H in one table will not be the same size integral as 1 H in the other table unless the concentrations of the two compounds in the sample are the same.
However, comparing the ratio of two integrals for two different compounds can give you the ratio of the two compounds in solution, just as we could determine the ratio of benzene to acetone in the mixture described above.
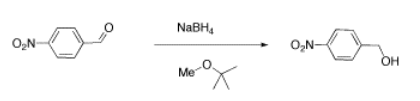
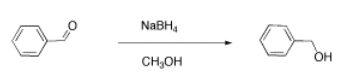
We will look at two examples of sample mixtures that could arise in lab. Results like these are pretty common events in the labIn the first example, a student tried to carry out the following reaction, a borohydride reduction of an aldehyde. The borohydride should give a hydride anion to the C=O carbon; washing with water should then supply a proton to the oxygen, giving an alcohol.
Her reaction produced the following spectrum.
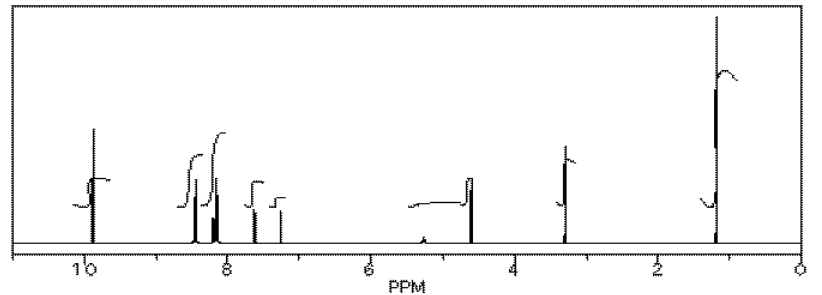
(simulated data)
From this data, she produced the table below.
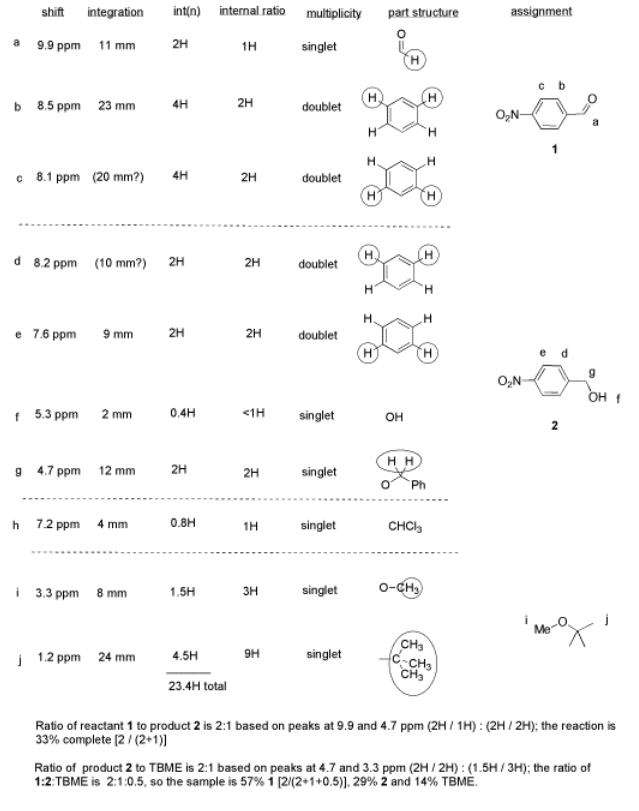
Notice how she calculated that ratio. She found a peak in molecule 1, the aldehyde, that she was pretty sure corresponded to the aldehydic hydrogen, the H attached to the C=O; in other words, the CH=O. She found another peak from molecule 2, the alcohol, that she was pretty sure represented the two hydrogens on the carbon attached to oxygen, the CH2-O.
The integrals for those two peaks are equal. They are both 2H in her table. However, she notes that within each molecule, the first integral really represents 1H and the second represents 2H. That means there must be twice as many of molecule 1 as there are molecule 2. That way, there would be 2 x CH=O, and its integral would be the same as the 1 x CH2-O in the other molecule.
One way to approach this kind of problem is to:
- choose one peak from each of the two compounds you want to compare.
- decide how many hydrogens each peak is supposed to represent in a molecule. Is it supposed to be a CH2, a CH, a CH3?
- divide the integral value for that peak by that number of hydrogens it is supposed to represent in a molecule.
- compare the two answers (integral A / ideal # H) vs (integral B / ideal # H).
- the ratio of those two answers is the ratio of the two molecules in the sample.
So there is twice as much aldehyde as alcohol in the mixture. In terms of these two compounds alone, she has 33% alcohol and 66% aldehyde. That's \(\frac{1}{1+2} \times \%\) for the alcohol, and \(\frac{2}{1+2} \times 100 \%\)( 2/(1+2) )for the aldehyde. That calculation just represents the amount of individual component divided by the total of the components she wants to compare.
There are a number of things to take note of here.
- Her reaction really didn't work very well. She still has majority starting material, not product.
- She will get a good grade on this lab. Although the experiment didn't work well, she has good data, and she has analyzed it very clearly.
- She has separated her data table into different sections for different compounds. Sometimes that makes it easier to analyze things.
- She has noted the actual integral data (she may have measured the integral with a ruler) and also converted it into a more convenient ratio, based on the integral for a peak that she felt certain about.
- She went one step further, and indicated the internal integration ratio within each individual compound.
- She calculated the % completion of the reaction using the integral data for the reactant and product, and she made clear what part of the data she used for that calculation. A similar procedure could be done if a student were just trying to separate two components in a mixture rather than carry out a reaction.
- She also calculated the overall purity of the mixture, including a solvent impurity that she failed to remove.
- However, CHCl3 is not included in her analysis of purity. CHCl3 really isn't part of her sample; it was just present in the NMR solvent, so it does not represent anything in the material she ended up with at the end of lab.
Another student carried out a similar reaction, shown below. He also finished the reaction by washing with water, but because methanol is soluble in water, he had to extract his product out of the water. He chose to use dichloromethane for that purpose.
He obtained the following data.
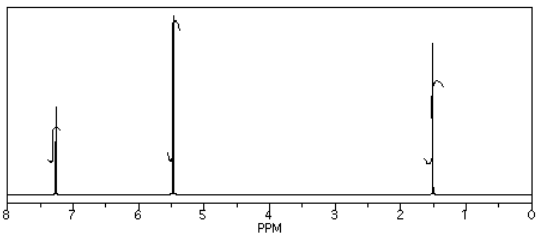
From this data, he constructed the following table.
There are some things to learn about this table, too.
- Does the integration ratio really match the integral data? Or is this just wishful thinking?
- This table might reflect what he wants to see in the data. But what else could be in the data?
- CHCl3 is often seen in NMR spectra if CDCl3 is used for the NMR sample. It's there, at 7.2 ppm.
- "Leftover" or residual solvent is very common in real lab data. There it is, CH2Cl2 from the extraction, at 5.4 ppm.
- What about water? Sometimes people don't dry their solutions properly before evaporating the solvent. There is probably water around 1.5 to 1.6 ppm here.
This student might not get a very good grade; the sample does not even show up in the spectrum, so he lost it somewhere. But his analysis is also poor, so he will really get a terrible grade.
Three students performed a synthesis of a fragrant ester, ethyl propanoate, CH3CH2CO2CH2CH3. During their reactions, they each used a different solvent. The students were able to see peaks in the NMR spectrum for ethyl propanoate, as well as peaks for chloroform (CHCl3, in the CDCl3 they used to make their NMR samples).
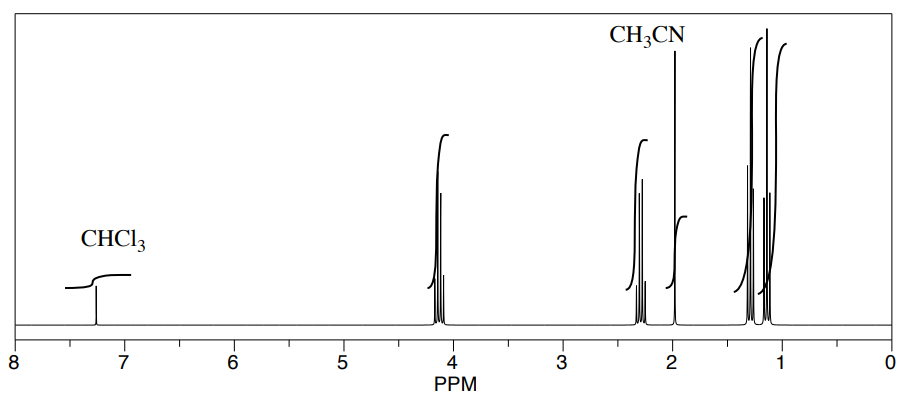
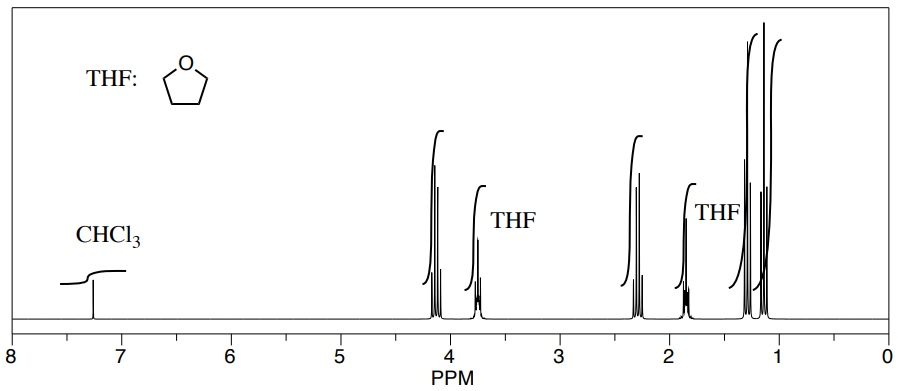
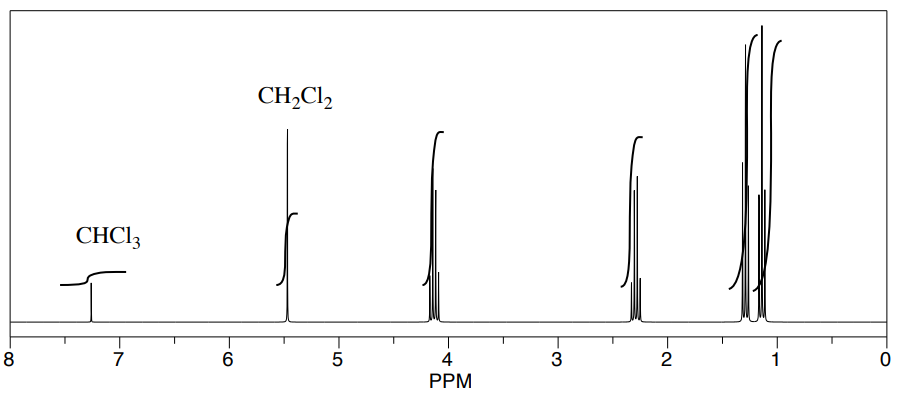
They were also able to determine that they had some leftover solvent in their samples by consulting a useful table of solvent impurities in NMR (which they found in Goldberg et. al., Organometallics 2010, 29, 2176-2179).
- What is the ratio of leftover solvent to ethyl propanoate in each sample?
- What is the percent of each sample that is leftover solvent?
- Answer
-
a) student 1: Let's use the H2C-O peak of ethyl propanoate at 4 ppm and the acetonitrile methyl at 2 ppm. The ratio appears to be 2:1, but they represent 2 protons and 3 protons, respectively. That means the ratio of molecules is 2/2:1/3 = 3:1 ethyl propanoate : acetonitrile.
student 2: We'll use the H2C-O peak of ethyl propanoate at 4 ppm and the H2C-O peak of THF at 3.5 ppm. The ratio appears to be 3:2, but they represent 2 protons and 4 protons, respectively. That means the ratio of molecules is 3/2:2/4 = 12:4 = 3:1 ethyl propanoate : THF.
student 3: Look at the H2CCl2 peak of dichloromethane at 5 ppm and the H2C-O peak of THF at 4 ppm. The ratio appears to be 1:2, and they both represent 2 protons, so the ratio of molecules is 1:2 dichloromethane : ethyl propanoate.
b) student 1: The sample is \([\frac{1}{1 + 3}] \times 100 \% = 25%\) acetonitrile.
student 2: The sample is \([\frac{1}{1 + 3}] \times 100 \% = 25%\) THF.
student 3: The sample is\([\frac{1}{1 + 2}] \times 100 \% = 33%\) acetonitrile.
A student attempted to add a Grignard reagent to benzaldehyde.
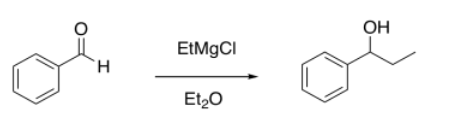
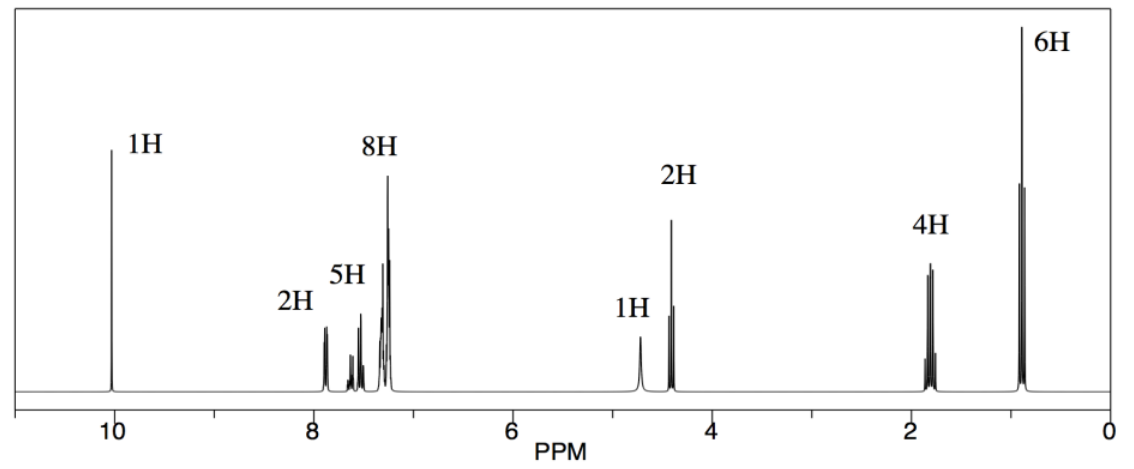
She obtained the following data (well, this is a simulated spectrum). What was the composition of her product?
- Answer
-
The obvious NMR handles are the H-C=O aldehyde proton at 10 ppm for benzaldehyde and the alcohol-adjacent H-C-O proton at 4.5 ppm for 1-phenylpropanol.
Each of those peaks represents one proton, so the integral ratio of 1:2 suggests a ratio of bezaldehyde to 1-phenylpropanol of of 1:2. That translates into 33% benzaldehyde, 67% 1-phenylpropanol.
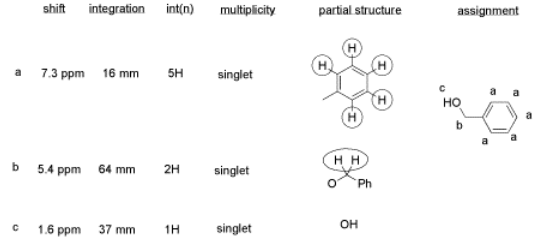
A student attempted to run a Swern oxidation on benzyl alcohol.
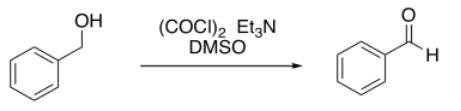
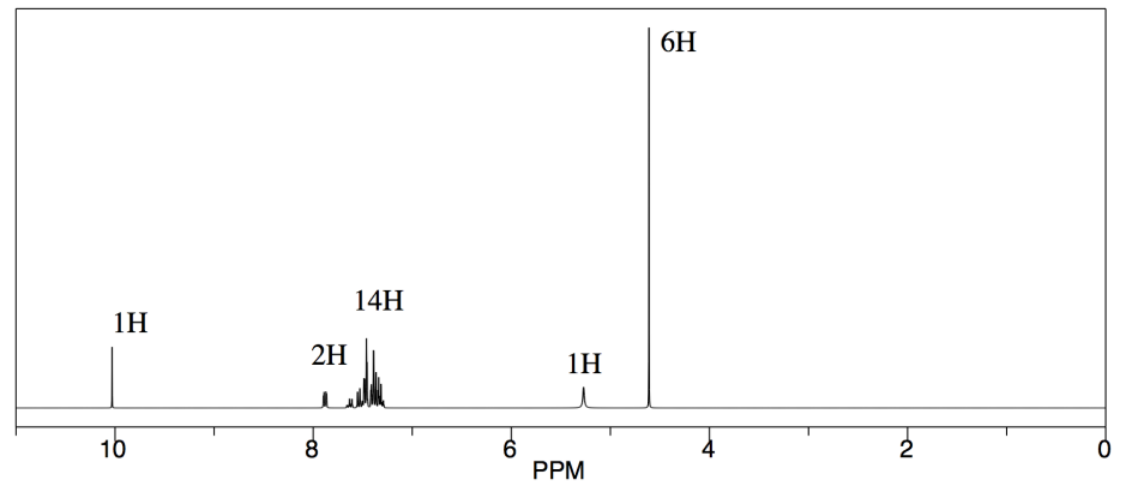
She obtained the following data (simulated spectrum). What was the composition of her product?
- Answer
-
The NMR handles here are the H-C=O aldehyde proton at 10 ppm for benzaldehyde and the alcohol-adjacent H2C-O protons near 5 ppm for benzyl alcohol.
In this case, we need to correct for the differing numbers of protons represented by each peak: 1H for the aldehyde peak but 2H for the alcohol one. The integral ratio of 1:6 therefore suggests a ratio of bezaldehyde to 1-phenylpropanol of of 1:3. That translates into 25% benzaldehyde, 75% 1-phenylpropanol.
A student attempted to carry out a ring-opening trans-esterification polymerization.
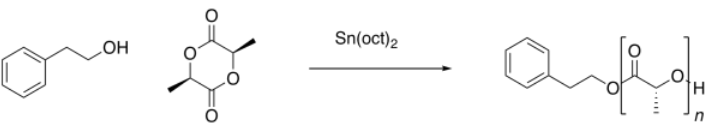
She obtained the following data (simulated spectrum). She knows that the alcohol should act as the initial nucleophile and should be found at the end of the polymer chain. What is the degree of polymerization (i.e. the number of repeating units in the chain)?
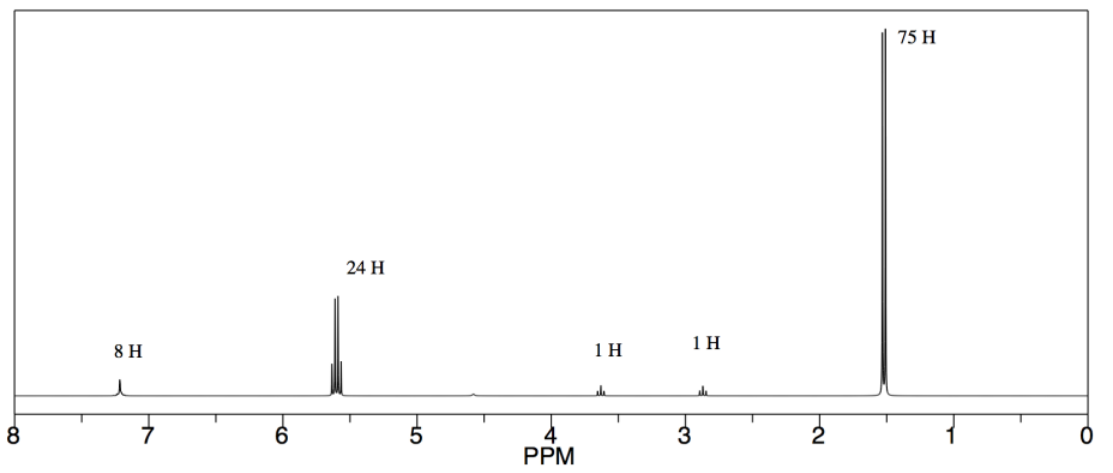
- Answer
-
We could use the peak corresponding to the O-CH-C=O proton above 5 ppm for the repeat unit and the peak for the CH2-O proton in the initiator/end group near 3.5 ppm. The integral ratio is 24:1, but they represent different numbers of hydrogens, so the repeat unit to end group ratio is really 24/1:1/2, or 48:1. The degree of polymerization is 48.