
4.8: Chemical Shift in Proton Spectra
- Page ID
- 194878

The trends here are exactly the same as in carbon spectra. Wherever the carbon goes, it takes the proton with it. Proton spectra are only around 10 ppm wide, compared to the 200 ppm of carbon spectra, so by analogy with carbon spectra,
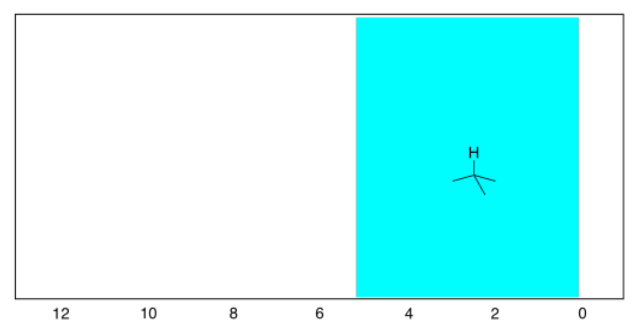
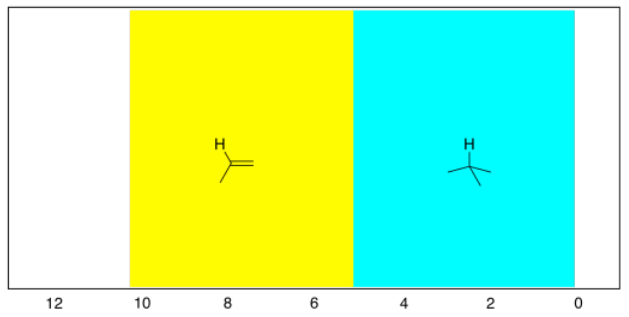
- hydrogens on sp3 carbons usually show up in the upfield half of the spectrum, about 0 to 5 ppm.
- hydrogens on sp2 carbons usually show up in the downfield half of the spectrum, about 5 to 10 ppm.
- within these two halves of the spectrum, electronegative atoms attached to the same carbon as a proton will draw that proton downfield.
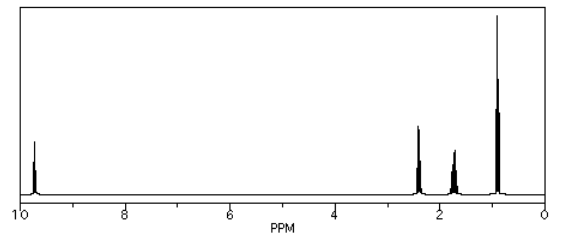
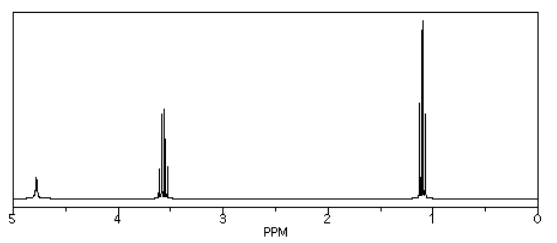
So, in the spectrum of hexane (CH3CH2CH2CH2CH2CH3) all of the hydrogens are on sp3 or tetrahedral carbons. They all show up below 5 ppm. There are no electronegative atoms around, so they are even further upfield, at 1 ppm.
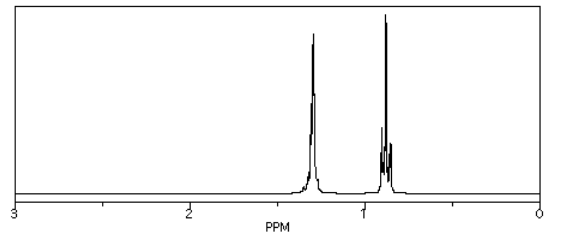
Source: Simulated spectrum.
Those peaks fall well within the expected window.
If we look at 1-hexene (CH2=CHCH2CH2CH2CH3), we see a similar spectrum, but two of the peaks show up above 5 ppm. These hydrogens are on sp2 or trigonal planar carbons. There are other, more subtle changes, but that is the main one.
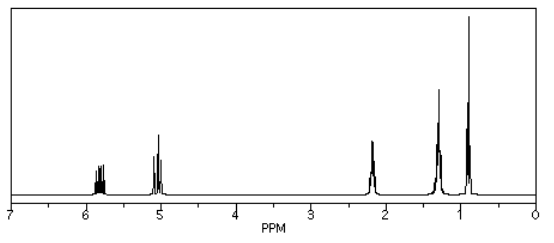
Source: Simulated spectrum.
Again, the new peaks fall right around where we would expect them.
The electronegativity shifts that we saw earlier of 13C NMR spectra hold true for 1H spectra as well. The more electronegative the neighbour of the carbon on which the proton is sitting, the further the proton will be shifted to the left in the spectrum.
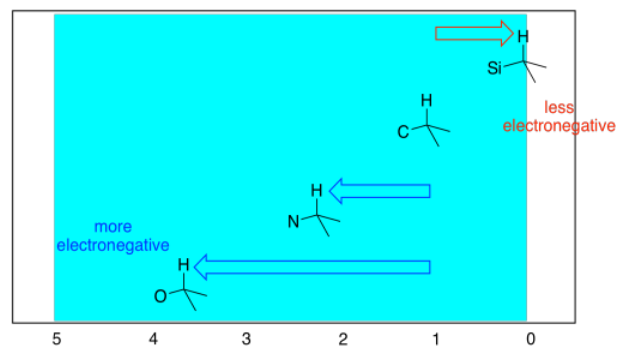
It can be useful to think of 1 ppm as the default position for a proton on a tetrahedral carbon, and to think of the effects of other groups as moving the peak a certain distance away from that starting point. For example, a neighbouring oxygen atom moves the peak 2.5 ppm to the left. Thinking of it that way helps you predict what will be the effect of two different attached groups. For example, if there were two oxygens attached to the carbon on which the proton is sitting, it would move 5 ppm, and end up at 6 ppm overall.
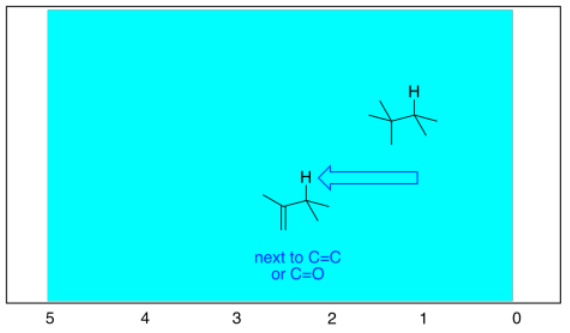
Just as in 13C NMR spectroscopy, there are more subtle effects of having sp2 carbon neighbors nearby. Once again, that's because of the effect that the magnetic field has on the electrons in the double bond.
We see similar trends in the left-hand, sp2 region. If we look at butanal (CH3CH2CH2CHO), we also have several hydrogen on sp3 carbons and one on an sp2 carbon. The former show up below 5 ppm and the latter above 5 ppm. This time, that peak is way downfield at 10 ppm. That hydrogen is on a carbonyl carbon; being double bonded to an oxygen deshields the carbon, and its partner hydrogen a lot.
Source: Simulated spectrum.
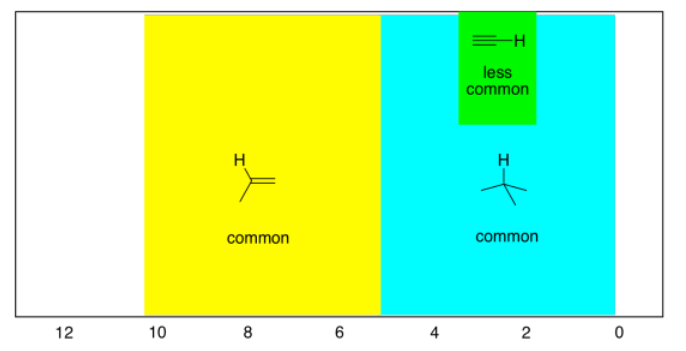
As before, there are also hydrogens on linear or sp carbons, although they are much less common than tetrahedral or trigonal carbons.
- hydrogens on sp carbons show up between 2 and 6 ppm, and most often between 2 and 3 ppm.
Remember, these are general rules that you should know. The proton in chloroform shows up at 7 ppm although it is attached to a tetrahedral carbon, because it has three different, electronegative chlorines pulling it to the left. (World-record shifts occur for hydrogens attached to transition metals: "late" metals like ruthenium or rhodium can move hydrogen peaks all the way up to -20 ppm, but "early" metals like tantalum can move them down as far as 25 ppm.)
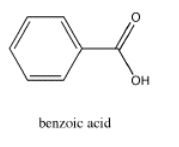
One word of caution: students often catch on to the electronegativity rule and immediately make assumptions about OH groups that turn out not to be true. The obvious conclusion so far is that OH groups should always show up at the left hand of the spectrum, because the hydrogen is directly attached to that very electronegative oxygen. That can sometimes be true: the proton in a carboxylic acid, if it can be seen in the spectrum at all, generally shows up around 12 ppm. However, the proton in water is usually around 1.5 ppm. In fact, protons on OH groups in slightly different situations cover the entire range of the proton spectrum.
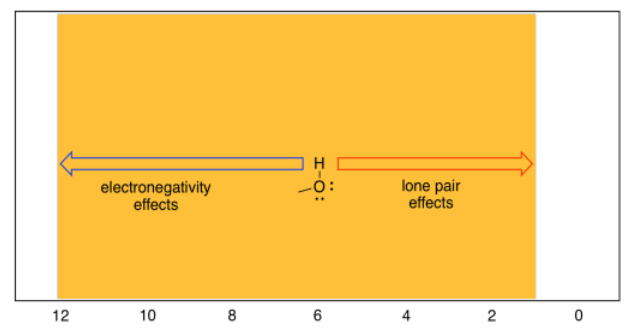
The reason for this wide range has to do with the fact that, although oxygen is very electronegative (so its neighbouring hydrogen should be electron-poor) it also posesses lone pairs. Those lone pairs have the effect of shielding the hydrogen from the magnetic field. Thus, there are two competing effects in OH protons, and different situations tilt the balance one way or another.
Indicate whether each of the following peaks in the 1H NMR spectrum probably represents a hydrogen on a tetrahedral carbon (H-Csp3) or a hydrogen on a trigonal planar carbon (H-Csp2).
a) 1.1 ppm b) 3.4 ppm c) 7.8 ppm d) 4.2 ppm e) 5.7 ppm f) 9.9 ppm g) 2.3 ppm
- Answer
-
a) H-Csp3 b) H-Csp3 c) H-Csp2 d) H-Csp3 e) H-Csp2 f) H-Csp2 g) H-Csp3
The following peaks in the 1H NMR spectrum represent hydrogen atoms on tetrahedral carbons (H-Csp3). Indicate whether that carbon is probably attached to another tetrahedral carbon, an oxygen, or a nitrogen.
a) 1.1 ppm b) 1.9 ppm c) 2.5 ppm d) 4.2 ppm e) 1.8 ppm f) 3.6 ppm g) 2.7 ppm
- Answer
-
a) carbon b) carbon c) nitrogen d) oxygen e) carbon f) oxygen g) nitrogen
Although aromatic C-H and alkene C-H are both bound to sp2 carbons the following peaks in the 1H NMR spectrum probably represent hydrogen atoms on alkene carbons or aromatic carbons.
a) 7.3 ppm b) 8.3 ppm c) 5.1 ppm d) 6.2 ppm e) 5.4 ppm f) 7.8 ppm
- Answer
-
a) aromatic b) aromatic c) alkene d) alkene e) alkene f) aromatic
The following peaks in the 1H NMR spectrum represent hydrogen atoms on trigonal planar carbons (H-Csp2). Indicate whether that carbon is probably attached to another trigonal planar carbon in an aromatic ring, is single-bonded to a nitrogen in an aromatic ring, or is double-bonded to an oxygen.
a) 7.1 ppm b) 6.9 ppm c) 8.5 ppm d) 10.2 ppm e) 9.8 ppm f) 8.2 ppm g) 7.9 ppm
- Answer
-
a) H-CAr-C b) H-CAr-C c) H-CAr-N d) C=O e) C=O f) H-CAr-N g) H-CAr-N
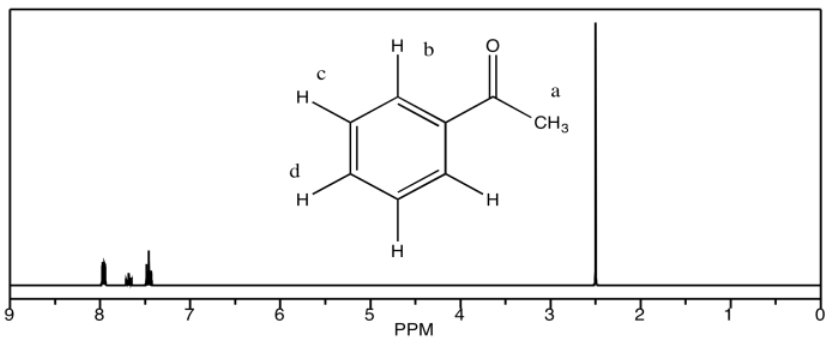
Looking at the 1H NMR spectra of the following compounds, indicate which peak belongs to which proton.
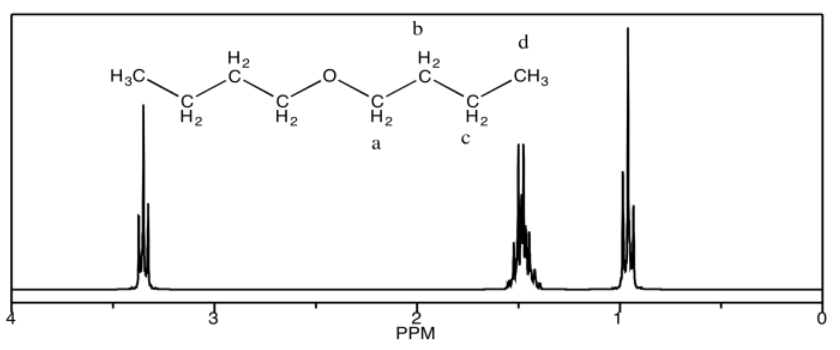
a) dibutyl ether
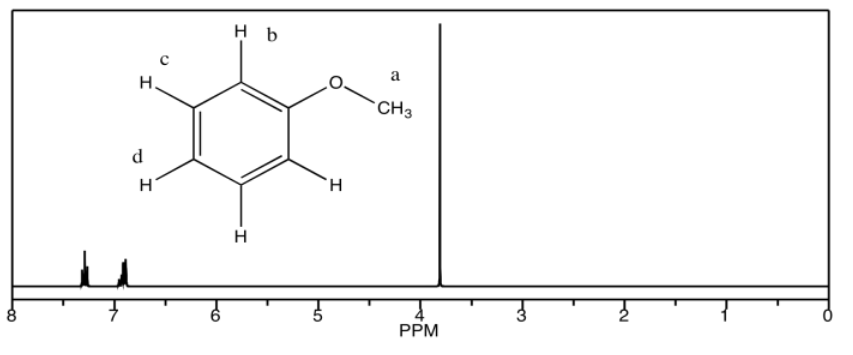
b) methyl phenyl ether
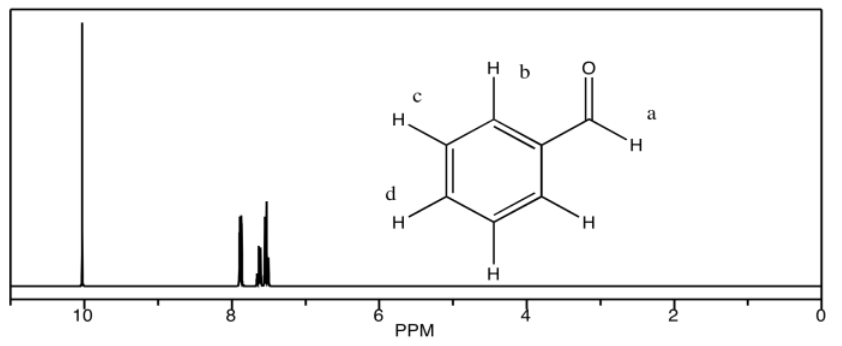
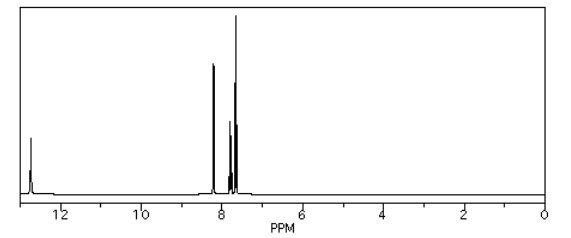
c) benzaldehyde
d) acetophenone
- Answer
-
a) 3.4 ppm: Ha 1.5 ppm: Hb, Hc 0.9 ppm: Hd
b) 7.4 ppm: Hd 6.9 ppm: Hb, Hc 3.7 ppm: Ha
c) 10.1 ppm: Ha 7.9 ppm: Hb 7.6 ppm: Hd 7.5 ppm: Hc
d) 7.9 ppm: Hb 7.6 ppm: Hd 7.4 ppm: Hc 2.5 ppm: Ha
Sketch a 1H NMR spectrum for each of the following compounds, showing a simple line corresponding to the expected shift for each of the different hydrogens.

- Answer
-
a)

b)

c)

d)

Notice that a major difference from 13C NMR is that a carbon spectrum is spread out over 200 ppm, while a typical proton spectrum is compressed into about 10 ppm. There is a consequence of that difference, and it can be frustrating. It is usually easy to distinguish two different 13C peaks, whereas two peaks in the 1H spectrum could easily be so close together that they overlap. For example, the aliphatic hydrocarbons hexane and nonane display only two distinct peaks in the 1H spectrum, one for the methyl hydrogens and one for the methylene hydrogens, because the latter are all too similar to tell apart given the limited amount of resolution in the spectrum.
- coincidental overlap of peaks in the 1H spectrum is common.
There is another complication in the chemical shifts seen in 1H spectroscopy, and that is the behavior of protons attached directly to heteroatoms such as oxygen and nitrogen. Oxygen is very electronegative, and hydrogen is not, so it stands to reason that an OH proton would absorb at very low field, say 10 ppm. That's completely wrong. OH protons in aliphatic alcohols show up between 2 and 6 ppm, phenolic OH protons between 5 and 9 ppm, and carboxylic acid OH protons between 11 and 12 ppm. Water shows up around 1.6 ppm when dissolved in chloroform, but if the water is present in high concentrations it can show up further downfield. Thus:
- a proton attached to oxygen shows up between 1 and 12 ppm.
- hydroxy proton shifts can vary depending on factors such as hydrogen bonding with the solvent and other molecules.
- except for carboxylic acid protons, which occur beyond the normal range of other peaks, a peak showing up at a particular shift is not strong evidence for the presence of an OH proton.
Source: Simulated spectrum.
Source: Simulated spectrum.
Although oxygen is very electronegative, it also has two lone pairs of electrons; those lone pairs on oxygen are often crucial in understanding chemistry. The oxygen atom does pull electron density away from the hydrogen through the sigma bond between them, but the lone pairs also bathe the nearby hydrogen in the shielding effects of their electron density. Depending on how these two factors balance out, OH and NH protons don't absorb nearly as far downfield as expected.