
3.1: Introduction
- Page ID
- 189761

This chapter will focus on infrared (IR) spectroscopy. The wavelengths found in infrared radiation are a little longer than those found in visible light. IR spectroscopy is useful for finding out what kinds of bonds are present in a molecule, and knowing what kinds of bonds are present is a good start towards knowing what the structure could be.
What does an IR spectrum look like?
A spectrum is a graph in which the amount of light absorbed is plotted on the y-axis and frequency is plotted on the x-axis. An example is shown below. You can run your finger along the graph and see whether any light of a particular frequency is absorbed; if so, you will see a "peak" at that frequency. If not, you will see "the baseline" at that frequency.
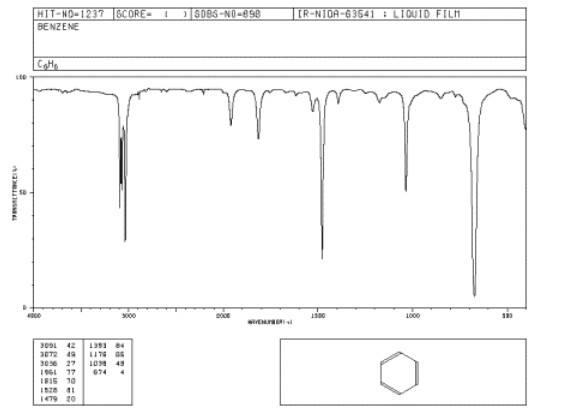
Figure \(\PageIndex{1}\): IR spectrum of benzene. The x-axis labels are, from right to left, 500, 1000, 1500, 2000, 3000 and 4000 cm-1. Source: SDBSWeb : http://riodb01.ibase.aist.go.jp/sdbs/ (National Institute of Advanced Industrial Science and Technology of Japan, 14 July 2008)
In IR spectra (spectra = plural of spectrum):
- the y axis is usually labeled "transmittance". Transmittance is the amount of light that passes through the sample.
- the unit of transmittance is percent (%).
- the x axis is labeled "wavenumbers". Wavenumbers are proportional to frequency, so the higher the frequency, the higher the wavenumber.
- the symbol for wavenumber is reciprocal centimeters (cm-1).
- the x-axis is usually displayed with high wavenumber on the left and lower wavenumber on the right.
As you run your finger from left to right across an IR spectrum, you can see whether or not light is absorbed at particular frequencies. When the curve dips down, less light is transmitted. That means light is absorbed. The dip in the graph is called a peak. Different bonds absorb different frequencies of light, so the peaks tell you what kinds of bonds are present.