
2.1: Introduction to UV Spectroscopy
- Page ID
- 189754

To begin a story about spectroscopy, it is probably easiest to start with wavelengths of light that people can see. There are all kinds of electromagnetic radiation around us, mostly coming from the sun, and just a thin slice of the wavelengths in the middle are visible to the eye.
You probably already know that if you look at a white light, what you are seeing is really a composite, a blend of all different colors of light. If you shine that light through a prism (really, any glass object that varies in thickness, that has a thicker edge and a thinner edge), you can separate the white light into these different colors.

So what happens when you see a colored object? Maybe a cobalt blue pickup truck or a red barn? The object is absorbing some of those photons, those little packages of light. But the object is very selective; it will take these photons, but not those ones, and not those other ones, either.
The color that you see is made of just the leftover photons, the ones that did not get absorbed. We sometimes use the color wheel to keep track of this phenomenon. Partly because of how our eyes process light, when something absorbs a color on one side of the color wheel, we see the color on the opposite side.
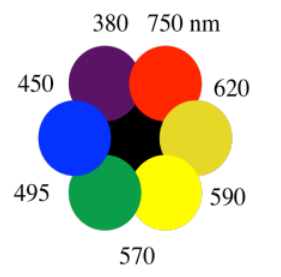
When something absorbs orange photons, for instance, we see the complementary color, the one on the opposite side of the color wheel. We see blue. So the pickup truck looks blue because it absorbs the orange light. The barn looks red because it absorbs green light.
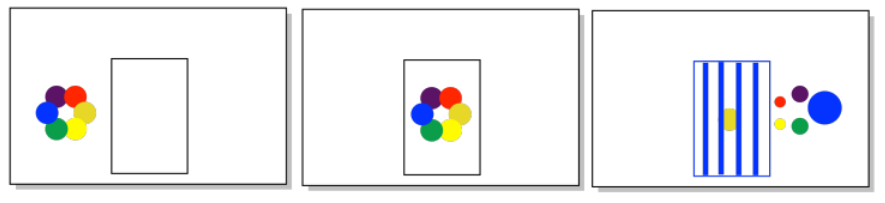
You observe a colored object. Estimate the wavelength of light that was absorbed by the object.
a) a green apple b) a yellow banana c) a red cherry d) a deep purple grape
- Answer
-
a) 700 nm (just an estimate, but maybe somewhere between 620 and 750 nm)
b) 425 nm c) 540 nm d) 580 nm
So what causes different things to absorb different colors of visible light? There are different factors with different kinds of materials. What they all have in common, however, is that they involve electronic transitions. Actually, the same is true for ultraviolet light, although we can't see that far into the spectrum. When ultraviolet or visible light are absorbed, in general the photons are interacting with electrons in the material.
And what happens to the electrons when they interact with the light? Well, photons have energy, so when the photons interact with the electrons, they transfer their energy to the electrons. We say that the electrons become excited, or that they are promoted to a higher level. If we look at a simple Bohr model of the atom, from the early 20th century, we think of the electrons orbiting the nucleus in shells. Each shell is a little farther from the nucleus, and at a higher energy than the one below it. If an atom absorbs a photon, one of the electrons gets promoted to a higher level.
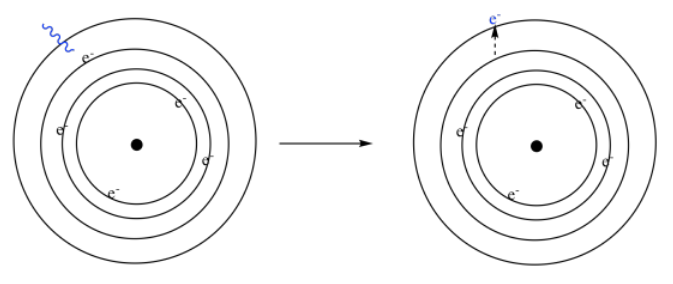
These electronic energy levels occur at very specific intervals. That's why a specific atom might absorb only specific photons. The energy of the photon has to match, more or less exactly, the amount of energy an electron would need in order to jump from one level to another.
Now, it might seem that any atom would have lots of different possible electronic energy levels giving rise to lots of possible transitions between one level and another. In that case, any atom should absorb or give off all kinds of photons, and we shouldn't see any specific color at all. However, there really are some limitations on the possible transitions in a given atom. What's more, almost all of these transitions correspond to ultraviolet energy, which we can't see anyway, and so what we do observe are the few transitions that actually involve visible light.
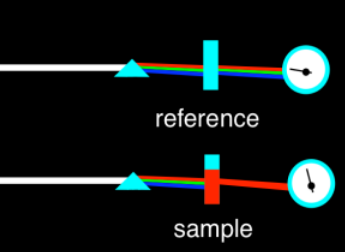
We can measure the wavelengths of light that are absorbed by a material using a UV spectrometer. The spectrometer produces a graph of absorbance versus wavelength. The wavelength, on the x axis, is usually measured in nanometers. The absorbance, on the y axis, is usually dimensionless; that's because it's a fraction. It's the ratio of how much light is absorbed by the sample compared to how much was absorbed by some reference, something to which we compare the sample. In most cases, the sample is dissolved in a solvent such as water of ethanol, so the reference is just plain solvent. That solution is held in a clear vessel called a cuvette, often made of quartz or a type of plastic that does not absorb much light in the wavelengths that we want to look at.
The typical graph we get looks like a wide, rounded hill, or maybe a couple of hills. It might seem like maybe there should just be one wavelength that gets absorbed, given what we have these very specific electronic transitions allowed. That may be true with gas phase atoms, but in the condensed phase -- in solids or liquids or in solutions -- things get much messier. There are lots of reasons for that, most of which seem entirely unrelated to light absorption, such as collisions and other interactions between molecules that are sloshing around in the cuvette.
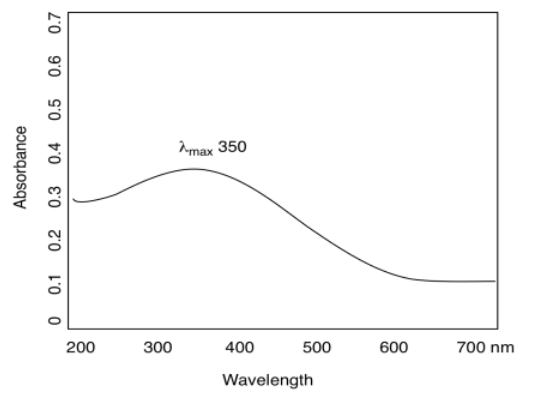
At any rate, the highest point on that hill is chosen as a sort of diagnostic index, called the absorption maximum or λmax. This is the wavelength at which the compound absorbs the most light. In the spectrum shown here, that point occurs around 350 nm, just outside the visible range.
- Answer
-
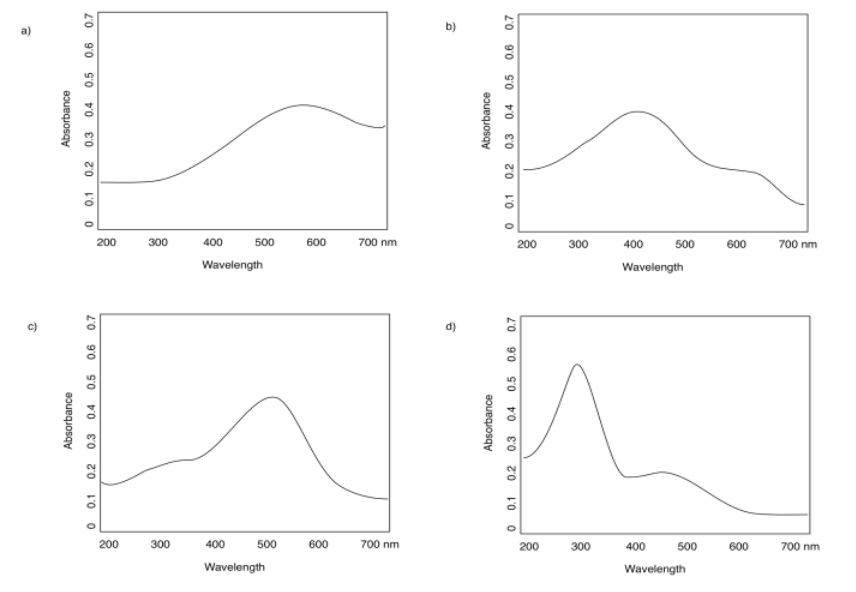
a) 590 nm b) 400 nm c) 500 nm d) 300 nm
Some of the spectra in the previous question have two different absorbances: a strong one and a weak one. Estimate the absorption maxima of each.
- Answer
-
a) 590 nm (strong); that's all b) 400 nm (strong); 600 nm (weak)
c) 500 nm (strong); 350 nm (weak) d) 300 nm (strong); 450 nm (weak)
You might wonder what happens after the electron gets excited. How does it get back down again? There are actually a few different ways for that to happen, but probably the most common way is via processes called radiationless relaxation, in which the energy absorbed from the photon is eventually lost to the surroundings. It often ends up in the form of heat.
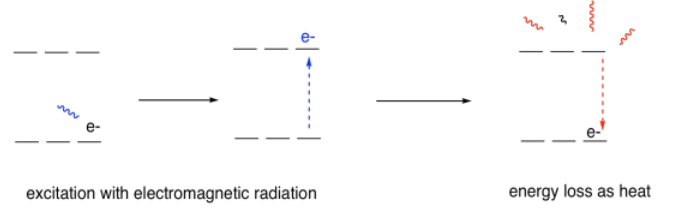
On the other hand, if an excited electron were to become excited in some other way, such as by great heat, and then fall from its promoted level back down into one below, the energy it lost could be given off by a photon. This phenomenon is called emission or fluorescence, depending on the circumstances. Again, only certain photons would be given off, depending on the atom involved.
That specificity allows analysts to study the composition of certain materials, such as mineral ores, or to look for metal ions in groundwater. It also supplies some of the fun of fireworks; people have known for some time that lithium and strontium salts are good for red fireworks, copper for blue ones, calcium for orange, barium for green, sodium for yellow.
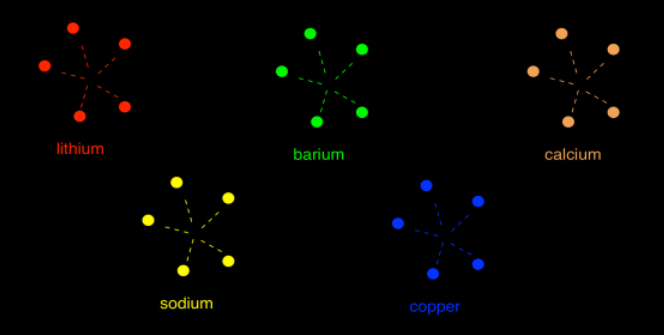
Rank these fireworks from the most energetic photon emitted to the least energetic.
- Answer
-
Remember, here we are observing the photons directly, rather than the onew complementary to the absorbed photons.
copper > barium > sodium > calcium > lithium