
7.8: Sigma and Pi Bonds
- Page ID
- 49306

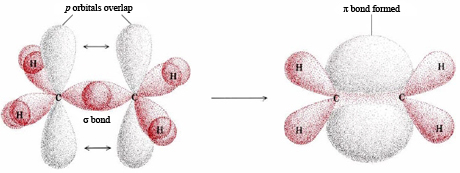
A description of the double bond is the sigma-pi model shown in Figure 1. In this case only two of the p orbitals on each C atom are involved in the formation of hybrids. Consequently sp2 hybrids are formed, separated by an angle of 120°. Two of these hybrids from each C atom overlap with H 1s orbitals, while the third overlaps with an sp2 hybrid on the other C atom. This overlap directly between the two C atoms is called a sigma bond, and is abbreviated by the Greek letter σ. This orbital has no nodes: electron density exists continuously from around one atom to the other atom.
To view the sigma bonding orbital, select N6. This is actually sigma bonding between C-C and some sigma-like bonding around the Hs as well. Focus on the yellow portion. By selecting N8 HOMO, you can see the pi orbital represented by the two lobes.
The sp2 hybrid orbitals on each carbon atom involve the 2s and two of the 2p orbitals, leaving a single 2p orbital on each carbon atom. A second carbon-carbon bond is formed by the overlap of these two remaining p orbitals. This is called a pi bond, Greek letter π. The pi bond (π bond) has two halves—one above the plane of the molecule, and the other below it. Each of the two electrons in the pi bond (π bond) exists both above and below the plane of the four H atoms and the two C atoms. The pi bond can be thought of as a standing wave with a single node in the plane of the molecule.
If your workstation is enabled for JCE Software, you will see two videos below which compare the behavior of a standing wave with zero nodes versus a standing wave with one node (otherwise, see the drum animation below). The wave with a single node has higher energy. The sigma bond between the two carbon atoms does not have a node in the plane of the molecule. The pi bond between the two carbon atoms has one node in the plane of the molecule. Thus the pi molecular orbital is higher in energy and is the highest occupied molecular orbital (the HOMO).
(a) No Nodes (b) Single Node
Standing Waves on a Wave Demonstrator. (a) The lowest energy form of a standing wave has no nodes. This is like the continual electron density in all directions around the sigma bonding orbital. (b) The second-lowest energy standing wave has a single node. This node is akin to the shape of the pi bond where there is no electron density along the plane.
Alternatively, we can envision the molecular orbitals with the Drum Model described earlier. Imagine the two atoms opposite one another where a diagonal meets the edge of the drum at extreme left and right points. The m1,0 mode has no nodes, so the maximum amplitude of the standing wave is between the atoms, representing a high electron density sigma bond. The m2,1 mode has a linear node between the atoms, and maximum amplitude in front of, and behind, the node, representing the pi bond. In 3D, this linear node would be a plane, separating the two lobes of high electron density that constitute the pi bond. Because the pi bond has less electron density between the atoms, it is of higher energy in the MO diagram and is weaker than the sigma bond.
Overall this sigma-pi picture of the double bond is reminiscent of a hot dog in a bun. The sigma bond (σ bond) corresponds to the frankfurter, while the pi bond corresponds to the bun on either side of it.
Although the sigma-pi picture is more complex than the bent-bond picture of the double bond, it is much used by organic chemists (those chemists interested in carbon compounds). The sigma-pi model is especially helpful in understanding what happens when visible light or other radiation is absorbed by a molecule. Further discussion on this topic is found in the sections on Spectra and Structure of Atoms and Molecules.
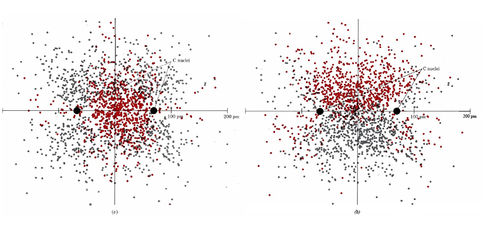
In actual fact the difference between the two models of the double bond (the first model described here and the second found in the section on Orbital Descriptions of Multiple Bonds) is more apparent than real. They are related to each other in much the same way as s and p orbitals are related to sp hybrids. Figure 2 shows two dot-density diagrams for a carbon-carbon double bond in a plane through both carbon nuclei but at right angles to the plane of the molecule. Figure 2a corresponds to a sigma-pi model with the sigma bond (σ bond) in color and the pi bond in gray. Figure 2b shows two bent bonds. Careful inspection reveals that both diagrams are dot-for-dot the same. Only the color coding of the dots is different. Thus the bent-bond and sigma-pi models of the double bond are just two different ways of dividing up the same overall electron density.
A similar situation applies to triple bonds, such as that found in a molecule of ethyne (acetylene), 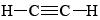 . As shown in Figure 3a,we can regard this triple bond as being the result of three overlaps of sp3 hybrids on different carbon atoms forming three bent bonds. Alternatively we can regard it as being composed of one sigma bond and two pi bonds, the sigma bond being due to the overlap of an sp hybrid from each carbon atom. Again both pictures of the bond correspond to the same overall electron density, and hence both are describing the same physical reality. We can use whichever one seems more convenient for the problem under consideration.
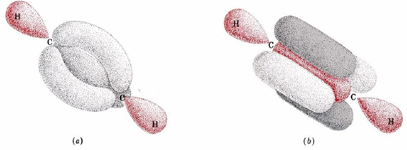 . (a) Three sp3 hybrids from each carbon atom overlap to form three bent bonds. (b) Two sp hybrids overlap to form the sigma bond. Two p orbitals on one carbon overlap with two on the other to form two pi bonds (one in light gray, the other in dark gray). Though these two models appear to be different, the indistinguishability of electrons makes them exactly equivalent.
The orbitals can be viewed by selecting from the orbital menu at right. Again, these orbitals are more easily represented using an MO Cutoff of 0.005. By selecting By selecting N1 you can see the sigma bonding orbital. The two pi bonding orbitals can be viewed by selecting N6 and N7. If you rotate the molecule so that we view the molecule along the H-C-C-H line, you can switch back and forth between N6 and N7 to see the orientation in space.