2.30: Radioimmunoassay (RIA)
- Page ID
- 120695
RELATED READINGS: Pages 187-200, 249-250, 254-256.
OBJECTIVES
Upon completion of this exercise, appropriate discussion, and related readings, the student will be able to:
- Explain the basic principles of RIAs.
- Use the data presented to construct a standard curve.
PRINCIPLE
Many immunoassays are based upon the competition between labeled and unlabeled antigen (Ag) for a limited number of binding sites on antibody (Ab) molecules. Radioimmunoassays (RIAs) use an unstable isotope to label the antigen. Commonly used isotopes are tritium (3H) and 125I.
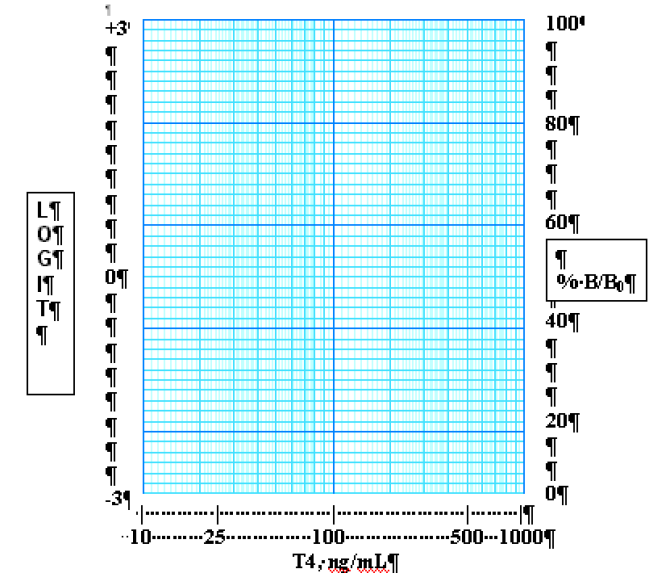
All RIAs are heterogeneous irnrnunoassays, that is, they require the separation of Ab-bound antigen from free, labeled antigen. Commonly used techniques for separating bound from free label include:naffixing the antibody to a solid phase (test tubes, Sephadex particles, or glass beads), precipitation of Ab-Ag complexes by a second Ab or polyethylene glycol, and absorption of free Ag by charcoal. Either the free or bound label (usually the latter) can be counted, and the amount of radioactivity (counts or disintegrations/minute) is related to the antigen concentration. This relationship is complex, and several mathematical equations have been used to “linearize” the data. One common technique is to plot the %B/B0 on a linear or logarithmic scale vs. the analyte concentration on a logarithmic scale. Another common technique is to use the logit plot of the standards (usually _5) which has the following relationship:
\[\text{logit} \frac{B}{B_{0}} = \ln \frac{\frac{B}{B_{0}}}{1 - \frac{B}{B_{0}}}\]
where: B = bound counts in the presence of unlabeled antigen, B0 = bound counts in the absence of unlabeled antigen, ln = natural logarithm
The logit calculation is usually plotted on a linear scale vs. the logarithm of the analyte concentration. It is important to remember that radioisotopes are considered hazardous, and there are strict regulations regarding their purchase, use, handling, and disposal. Before performing any radioisotope procedure, you must read the safety manual for your institution. Your instructor will review this information with you.
MATERIALS
Calculator or statistics table capable of performing natural logarithm transformations
PROCEDURE
- Using the information provided on the data sheet average the bound counts for the “0” standard. This is B0.
- Average the bound counts (this is B) for each sample and standard.
- Calculate B/B0, %B/B0, 1-B/B0, and then logit B/B0 for each sample.
- Plot %B/B0 (vertical axis) vs T4 concentration of the standards on the log scale (X, or horizontal axis) of the first graph provided.
- Plot logit B/B0 (vertical axis) vs T4 concentration of the standards on the log scale (X-axis) of the second graph provided.
- Determine the value of the T4 concentration in the unknown(s) by interpolation from both of the standard curves. Record on the Data Sheet.
Discussion Questions
- If the counts listed in the data sheet for the “0” standard (B0) were counted in one minute, what would the counting precision be? If these counts were accumulated during a 10 minute counting period, would the precision change?
- Why is the logit conversion frequently used for data reduction in competitive binding assays?
- What portions of the %B/B0 curve is most affected by the logit transformation? Does this improve the quality of the result?
- A vial of 125I labeled T4 is purchased with an activity of 10,000 cpm/\(\mu\)g (half-life = 2 months). The assay was not performed until 8 months later. What is the activity at that time?
| DATA SHEET, EXERCISE #30 |
NAME: ___________ DATE: ___________ |
RESULTS
Data from experiment:
| Sample | Cpm | Average cpm | B/B0 | 1-B/B0 | Logit B/B0 |
|---|---|---|---|---|---|
| T4 Standard (\(\mu\)g/L) | |||||
| 0(B0) | 43285 41003 | ||||
| 25 | 37449 33274 | ||||
| 50 | 33107 30010 | ||||
| 100 | 23662 21976 | ||||
| 150 | 19583 19227 | ||||
| 300 | 14164 12808 |
| Unknowns | Calculated T4, \(\mu\)g/L | |||||
|---|---|---|---|---|---|---|
| 1 | 37448 35754 | |||||
| 2 | 26867 24047 | |||||
| 3 | 34174 33970 | |||||
| 4 | 24427 24025 | |||||
| 5 | 19331 17790 |