
4.47: Quality Control Advanced
- Page ID
- 123351

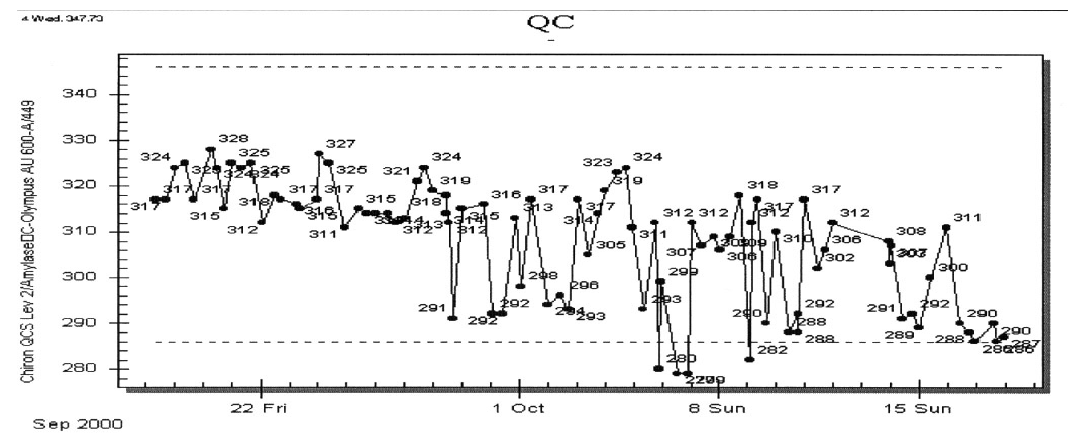
A quality control supervisor is reviewing routine quality control (QC) data for the three, random access, multi-channel chemistry analyzer in the laboratory. The supervisor notices the data in the following figures for amylaseon one of the instruments. She becomes very concerned and approached the supervisor responsible for the analyzer.
QUESTIONS
- What do you see in the figure that might have raised the supervisor’s concern?
- The QC supervisor brings the problem to the laboratory director to determine if this is an out-of-control situation requiring possible suspension of this test. The director decides that it is not, but asks that the QC supervisor document the problem (see page 394 of the textbook) and investigate it. The QC supervisor and the instrument supervisor review the QC data and discuss its possible cause. What easy steps could be taken to help determine the possible cause of the significant decrease in precision?
- The supervisor reviews the QC for amylase on the other two instruments and sees the following data.
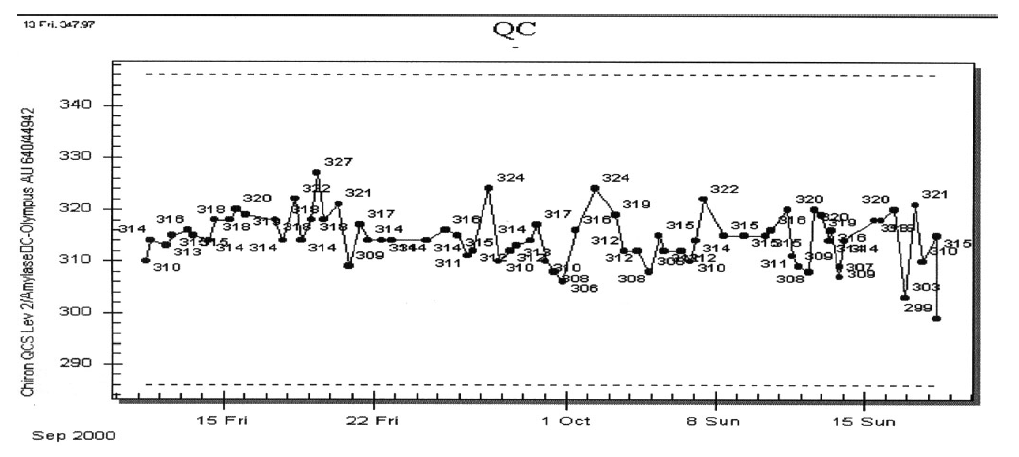
This pattern is pretty much the case for both levels of control material and for both of the other instruments. The supervisor begins to focus on the original instrument by reviewing the QC results for other tests. What test parameters would be of interest to the QC supervisor?
- The QC supervisor sees a mixed pattern of QC results. As one example, see the following figure for creatinine on the original instrument.
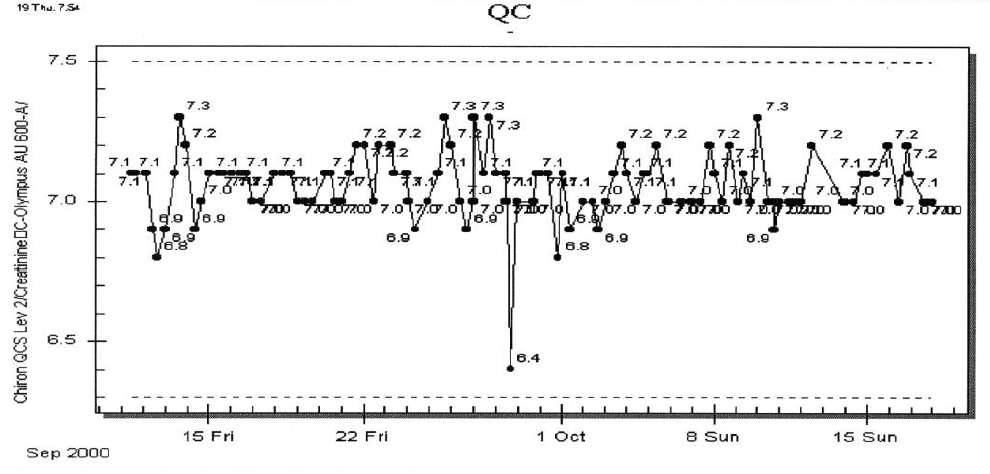
The supervisor is surprised to find that another assay on the same instrument shows excellent, consistent precision (except for one result on September 28th). Reviewing the QC data for the other assays, the pattern of mixed results is that some assays show good precision while others show varying diminishment in precision. One pattern begins to emerge: the degree of decreased precision seems to be related to the sample volume of the assays.
The supervisor believes that the likely cause of the problem is with the sample delivery system. The QC supervisor and the instrument supervisor perform basic maintenance on the instrument, concentrating on the sample delivery system. Changing the syringe and tubing does not seem to improve matters, so the company is called and the instrument is placed out of service. The company’s field engineer finds a faulty valve, which is a key component for maintaining precise delivery of sample. After repair, analysis continues. After a week, the QC for amylase is again reviewed; seen below.
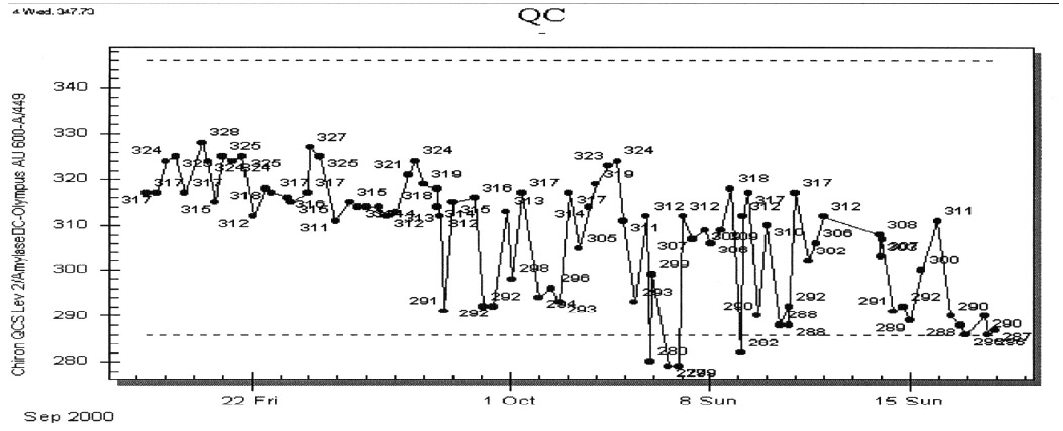
The QC results seem to have settled down by the 18th, but now it is obvious that there was a shift of the QC to lower results towards the end of September. The supervisor makes additional investigations. Based upon the previous discussion what do you think these additional investigations included?
Questions to Consider
- What type of changes might one see in quality control data over time?
- What factors might cause a changes from a stable pattern of QC data to a shift or trend?
- What might cause a significant decrease in precision?
- What different types of assays might be found on an automated chemistry analyzer?
- What test parameters or factors might result in changes in instrument performance?
There was no new lot of amylase reagent introduced into the laboratory for the past 6 months. However, the data from the PT samples indicate that the instrument in question has consistently lower results than the other two instruments, which are achieving the desired target value. Based on this information, the enzyme factor (see below) on the questionable instrument is adjusted to provide results consistent with the amylase results from the other analyzers. QC results improve and remain stable. All these investigations are documented.
ENZYME FACTOR
The basic calculation of enzyme activity (See chapter 54 and p 39, Chapter 1) is:
\[\frac{U}{L} = \frac{\Delta \text{Absorbance / min.} \times V_{total} \times 10^{6}\; (\mu \text{moles/mole})}{\epsilon \times V_{sample} \times \text{optical path length}}\]
For automated instruments the Vtotal, Vsample, the optical path length, extinction coefficient (\(\epsilon\)) are constants for every analysis. These constant can be grouped together and the above equation rearranged to read:
\[\frac{U}{L} = F \times \Delta \text{Absorbance / min.}\]
where
\[F = \frac{V_{total} \times 10^{6}\; (\mu \text{moles/mole})}{\epsilon \times V_{sample} \times \text{optical path length}}\]
- Answer
-
- The supervisor notices a change from stable QC results beginning about September 29th. The pattern seen above seems to be neither a shift nor a trend, but reflects a likely significant decrease in precision, possible associated with a shift to lower values. The new precision is determined to be significantly worse that the usual standard deviation (USD, see pp 385 and 390).
- Since there are two additional instruments of the same type, the supervisor could review the QC of the other two instruments. If the same pattern is seen for the other instruments, one could look for the things that are common among all three instruments, that is, reagent and QC. If the QC for the other instruments is acceptable, one needs to focus on the specifics of the first instrument, that is, a mechanical problem.
- As discussed above, the type of assay, how the assay’s signal is generated, and sample/reagent volume might be important factors in the review.
- The additional investigations included determining if there was a reagent lot change at the end of September and the analysis of frozen proficiency testing (PT) samples to be used as an accuracy check (see p 398). The old PT samples are analyzed on all three instruments.