
21: Kinetics of Enzyme Catalysis
- Page ID
- 144256

Name: ______________________________
Section: _____________________________
Student ID#:__________________________
Kinetics of Enzyme Catalysis
Enzyme kinetics is the study of chemical reactions catalyzed by enzymes.
Like other catalysts, enzymes provide an alternate pathway from substrate to product with a lower Ea yet the enzyme does not alter the equilibrium between substrates and products.
Note: These review topics on enzyme catalysis are covered in your OWL homework.Take notes here while completing your homework problems.
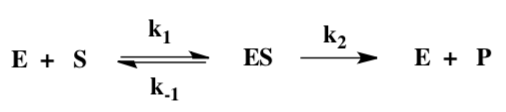
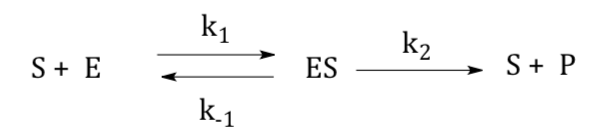
- Based on the following schematic of enzyme action, what is the minimumnumber of steps in any catalyzed reaction? (Hint: The middle complex is an intermediate.)
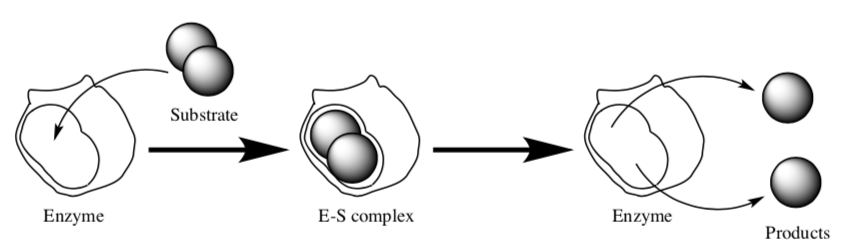
- Write a chemical equation for this reaction.
- Draw a reaction progress diagram that includes all of the steps.
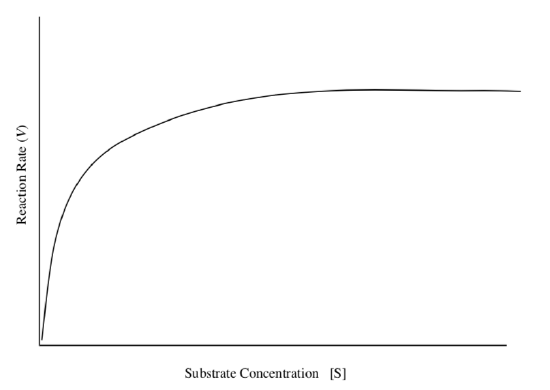
Saturation Kinetics
Unlike uncatalyzed chemical reactions, enzyme-catalyzed reactions display saturation kinetics. Biochemists and biologists often use the term ‘saturation’ when dealing an excess of substrate.
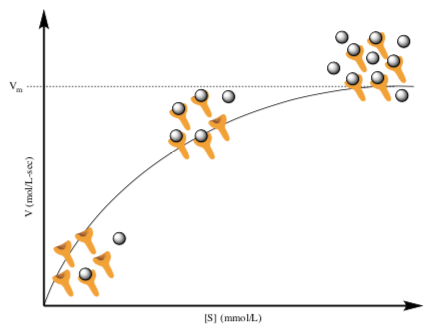
- Where is saturation occurring in the graph to the right?
- How can you tell that saturation is occurring from the graph?
- How can you tell that saturation is occurring from cartoons?
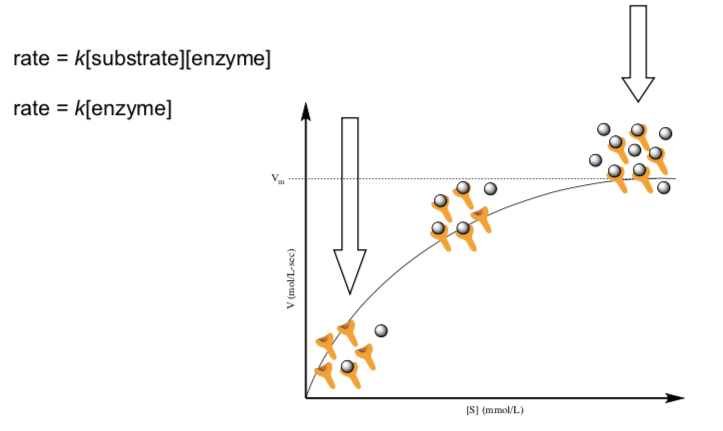
- The two rate laws below work at various points on the graph below. Try to match the rate to where the two large arrows point. (Hint: Find the point where increasing the substrate does not affect the velocity/rate.)
Michaelis-Menten Model
Michaelis–Menten kinetics is one of the simplest and best-known models of enzyme kinetics. It is named after German biochemist Leonor Michaelis and Canadian physician Maud Menten. This model is based on the single substrate reaction below:
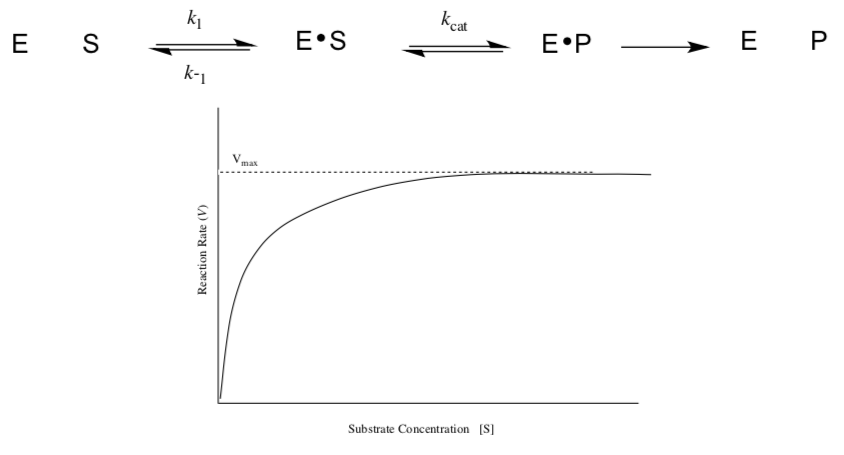
Because enzyme catalyzed reactions are saturable, their rate of catalysis does not show a linear response to increasing substrate.
- If the initial rate of the reaction is measured over a range of substrate concentrations (denoted as [S]), the reaction rate ( increases / decreases ) as [S] increases.
- As [S] gets higher, the enzyme becomes saturated with substrate and the rate reaches Vmax, the enzyme's maximum rate. When the enzyme reaches Vmax, the rate:
stops increasing | stops completely | keeps increasing
Michaelis-Menten Kinetics
Here is a simplified scheme for enzyme catalysis:
- In terms of [concentrations], what is the equilibrium constant (K) for enzyme- substrate binding?
Kassoc =
An equilibrium constant can also be described as the ratio of the rate at which products are formed to the rate at which products revert back to reactants.
K = kforward / kreverse
- In terms of rate constants (k), what is the equilibrium constant (K) for enzyme-substrate binding?
Kassoc =
- Turning the question around, in terms of concentrations, what is the equilibrium constant for dissociation of the enzyme-substrate complex?
Kdissoc =
- In terms of rate constants, what is the equilibrium constant for dissociation of the enzyme-substrate complex?
Kdissoc =
Note: k2 is also called kcat.
- What does kcat measure?
The term k2 is a composite rate constant; it really represents a number of steps.
- What are some types of mechanistic steps that might be represented by k2?
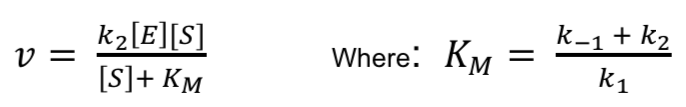
After a little heavy lifting with rate laws, we get:
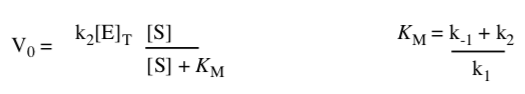
Here, [E]T is the total concentration of enzyme, whether or not it has bound substrate. Also, v0 (or sometimes v) means initial rate, before much substrate gets used up.
- Why might it be convenient to deal with the initial rate of a reaction? (hint: what happens to rate over time?)
KM is related to the equilibrium constant for enzyme-substrate dissociation.
- Why is it related? (what is similar about it?)
- What is different about KM compared to Kdissoc?
- KM is equal to the dissociation constant if (circle all that apply)
k2 is very fast | k2 is very slow | k1 is very fast | k-1 is very slow | k-1 is very fast
- Under that condition, what is the relationship between KM and Kassoc, the binding constant?
Remember, the rate reaches its maximum at high substrate levels, when all enzyme is busy churning out products and no enzymes are empty.
- If [S] is very large compared to KM, what is the rate (Vmax)?
- Why does the rate simplify this way under these conditions?
These conditions are called “saturation”: the enzyme is full. An experiment in which we measure kinetics at high levels of substrate is called a saturation kinetics experiment.
Turnover and Catalytic Efficiency
kcat gives a direct measure of the catalytic production of product under optimum conditions (saturated enzyme). kcat measures the number of substrate molecules turned over per enzyme molecule per second. Thus, kcat is sometimes called the turnover number.
Maximum turnover numbers of some enzymes
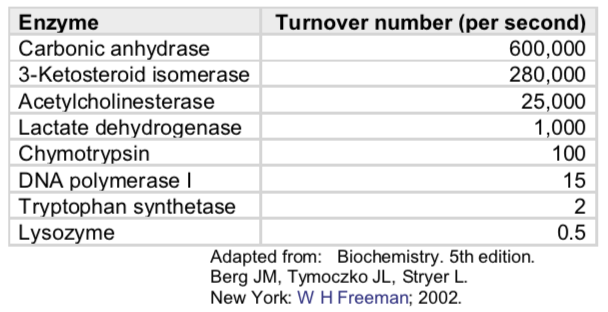
- A Thought Experiment: One molecule of the enzyme catalase can bind and cleave 10 million molecules of H2O2 per second. It does this one at a time, so imagine yourself as an enzyme grabbing a piece of paper, ripping it in half, and tossing the pieces aside. Can you do it once per second? How about twice? How about 10 million times per second?
- Why would biological systems have evolved to have such variation in the rate of enzymes?
kcat/KM - is thought of as a measure of enzyme efficiency. This ratio is important because it allows direct comparison of the effectiveness of an enzyme toward different substrates.
- Optimal kcat (rapid turnover) would be: Large OR Small
- Optimal KM (high affinity for substrate) would be: Large OR Small
- kcat/KM for an efficient enzyme would be: Large OR Small
Allosteric Enzymes
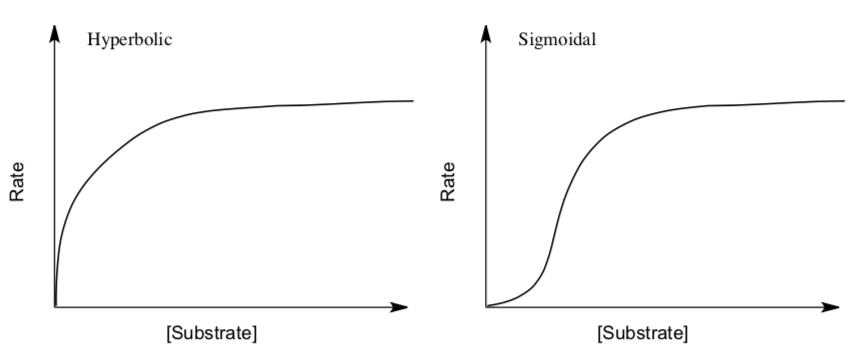
Allosteric Enzymes Do Not Obey Michaelis-Menten Kinetics
The Michaelis-Menten model cannot account for the kinetic properties of many enzymes. Allosteric enzymes are one major class of enzymes that do not obey Michaelis-Menten kinetics.
Allosteric enzymes often display sigmoidal plots of the reaction rate V0 versus substrate concentration [S], rather than the hyperbolic plots displayed by enzymes that do obey Michaelis-Menten kinetics.
Allosteric enzymes often have multiple subunits each with an active site that binds and catalyses the reaction.
Sometimes substrate binding becomes cooperative -- the binding of the substrate increases substrate binding to the other active sites.
- Suggest how the binding of the first substrate might increase binding for subsequent substrate molecules.
- Why does this affect the shape of the curves in the rate vs [substrate] plot?
Summary of Michaelis Menten Terms
- Define the following terms:
- saturation kinetics
- vmax
- kcat
- KM
- turnover
- kcat/KM
Application Problems
- Chymotrypsin, an endoprotease that cleaves after nonpolar aromatic side chains, can cleave the small amide and ester substrates below.
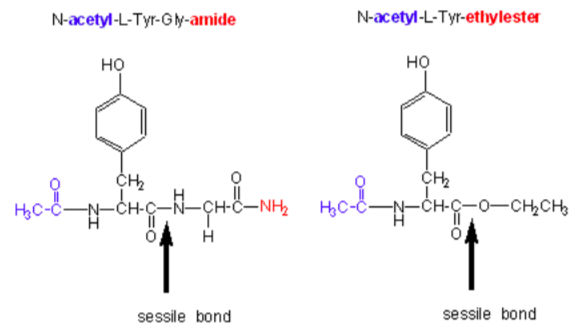
- Circle the leaving group on each. Which is better (assuming they leave unprotonated)? Why?
- Here is some kinetic data. Does that data support your answer?
Chymotrypsin substrate cleavage, 25oC, pH 7.9 kinetic constants Acetyl-Tyr-Gly- amide Acetyl-Tyr-O ethylester Ester/Amide kcat (s-1) 0.50 193 390 Km (M) 0.023 0.0007 0.03 kcat/Km (M-1s-1) 22 280,000 12,700 Now let’s change the substrate to have different leaving group.
X
kcat (s-1)
Km x 103 (M)
-OCH2CH3
27
0.097
-OCH3
28
0.095
-p-nitrophenol
31
0.002
-NH2
0.026
7.3
- Based on the structures alone, which of the leaving groups, X, is best? Why? Now compare kcat for the ester substrates. Does the nature of the leaving group matter? If not what does matter?
- Different Acetaldehyde Dehydrogenase Levels
The physiological consequence of KM is illustrated by the sensitivity of some individuals to ethanol. Such persons exhibit facial flushing and rapid heart rate (tachycardia) after ingesting even small amounts of alcohol. In the liver, alcohol dehydrogenase converts ethanol into acetaldehyde.
Normally, the acetaldehyde, which is the cause of the symptoms when present at high concentrations, is processed to acetate by acetaldehyde dehydrogenase.
Most people have two forms of the acetaldehyde dehydrogenase, a low KMmitochondrial form and a high KM cytosolic form. In susceptible persons, the mitochondrial enzyme is less active due to the substitution of a single amino acid, and acetaldehyde is processed only by the cytosolic enzyme.
- Because this enzyme has a high KM, ( more / less ) acetaldehyde is converted into acetate.
- Why do people with the less active mitochondrial enzyme display these physiological effects?
- Enzymes with a kcat / Km ratio of about 108 M-1s-1 are considered to show optimal catalytic efficiency.
Fumarase catalyzes the reversible-dehydration reaction:
fumarate + H2O -> malate
This enzyme has a high kcat / Km of 1.6 × 10⁸ for the substrate fumarate and 3.6 × 10⁷ for the substrate malate.
- Because the turnover number for both substrates is nearly identical, what factors might be involved that explain the different ratio for the two substrates?
- Explore the Michaelis-Menten kinetics graphically.
Visit the following website:
http://www.physiologyweb.com/calcula...nteractive_gra ph.html
What happens when the KM and vmax parameters change?
- To see how the plot changes when KM and vmax are changed by factors of two, click the appropriate button. Then, to make your own choices for the kinetic parameters, enter your values in both of the input boxes and click on "Plot Your Values". Note that your values must lie within a factor of ten of the initial values.
- Summarize your results.
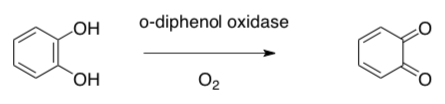
- The reaction that causes apple slices to turn brown when exposed to air:
Tube A Tube B Tube C Tube D [S] 4.8 mM 1.2 mM 0.6 mM 0.3 mM 1/[S] 0.21 0.83 1.67 3.33 rate 0.081 0.048 0.035 0.020 1/rate 12 21 29 50 There are different inhibitors for this enzyme.
- For each inhibitor, determine whether is competitive, noncompetitive or uncompetitive. Use Lineweaver-Burk plots to compare to the natural substrate.
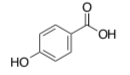
-
para-hydroxy benzoic acid (PHBA)
Tube A Tube B Tube C Tube D [S] 4.8 mM 1.2 mM 0.6 mM 0.3 mM 1/[S] 0.21 0.83 1.67 3.33 rate 0.060 0.032 0.019 0.011 1/rate 17 31 53 91 - phenylthiourea
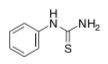
Tube A Tube B Tube C Tube D [S] 4.8 mM 1.2 mM 0.6 mM 0.3 mM 1/[S] 0.21 0.83 1.67 3.33 rate 0.040 0.024 0.016 0.010 1/rate 25 42 63 100
-
- For each inhibitor, determine whether is competitive, noncompetitive or uncompetitive. Use Lineweaver-Burk plots to compare to the natural substrate.
Interpreting MM Graphs
Finding KM from a Saturation Curve
The rate expression also simplifies when [S] = KM.
- What is the expression for V0 at that point?
- How is V0 related to Vmax at that point?
- On the following graph, identify the following points: Vmax, Vmax/2, KM.
Some people prefer to take the reciprocal of the Michaelis-Menten relationship.
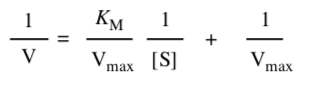
Plotting it this way gives a straight line, called a Lineweaver-Burk plot.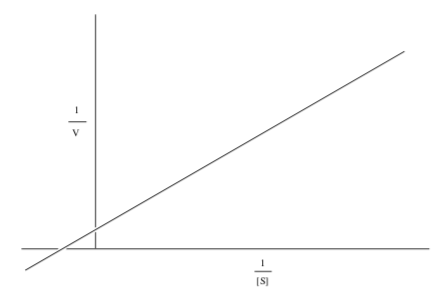
- What is the slope of the line?
- What is the y-intercept of the line?
- What is the x-intercept of the line?
- How do you find KM?
How to Prepare a Lineweaver-Burke Plot
Today, we will practice using Excel to graph Lineweaver-Burk plots of actual data.
- On a computer, use the directions in Canvas “How to Use Excel to Prepare a Lineweaver-Burk Plot”.
- Use the practice data set below to set up your spreadsheet:
Experiment 1 2 3 4 5 6 7 [S] (mM) 0.01 0.02 0.04 0.08 0.12 0.16 0.20 rate (μM/sec) 10 17 26 35 40 44 45
Once you have generated a Lineweaver-Burke Plot, you can use this graph to determine kinetics information for this system.
- Determine KM (with the correct units) from this plot. The units should match the units for [S] that you used.
- Determine Vmax (with the correct units) from this plot. The units should match the units for rates that you used.
Practice Problems
-
- Construct a Lineweaver-Burke plot for this data.
v nmol L-1 s-1 [S] nmol L-1 1.2 10 1.7 16 2.2 25 2.5 32 - What are the following values? Show your work. Assume [E] = 2 nmol L-1.
a) vmax b) Km c) efficiency
- Construct a Lineweaver-Burke plot for this data.
- For an enzyme (5 μM) , the following initial velocities have been reported depending on the substrate concentration:
[Substrate], mM v0, μM s-1 0.02 10.83 0.04 18.57 0.07 26.76 0.1 32.50 0.15 39.00 0.2 43.33 0.3 48.75 0.5 54.17 0.7 56.88 - Draw a Michaelis-Menten plot for this enzyme.
- Draw a Lineweaver-Burke plot for this enzyme.
- Determine vmax and KM for this enzyme
- Indicate in both graphs (a & b) where vmax and KM can be recognized.
- Calculate the catalytic efficiency for this enzyme.
- You are trying to reproduce experimental data from the previous student in the lab. She had reported that the enzyme under investigation has a kcat of 1875 s-1 and a catalytic efficiency of 7.5 107 M-1s-1.
- What is the KM of this enzyme?
- In repeating the measurement, you want to have a vmax of 10 mM s-1 (as this is easy to measure). How much enzyme should you use? Provide your result in μM.
- Calculate at which substrate concentrations in μM you should measure the initial rate v0 to obtain the following values:
[Substrate], μM V0, mM s-1 2.5 4.5 6.0 9.0 - Create a predicted Michaelis-Menten plot for your enzyme.
- Draw a predicted Lineweaver-Burke plot for your enzyme.
Summary of Enzyme Kinetic Graphs
- Explain how you could determine vmax and KM with a saturation curve.
- How does the saturation curve change for an allosteric enzyme? Why?
- Explain how you could determine vmax and KM from a Lineweaver-Burk plot.
- How does the saturation curve change in the presence of:
- competitive inhibitor?
- noncompetitive inhibitor?
- uncompetitive inhibitor?
- How does the saturation curve change for allosteric enzymes?
Application Problem
Kinetic Studies of Variations on an Enzyme
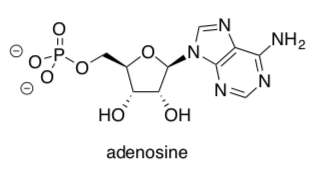
N5-Carboxyaminoimidazole ribonucleotide (N5-CAIR) synthetase carries out a key step in the biosynthesis of the purine nucleotides, such as adenosine, which after further modification are incorporated into nucleic acids.
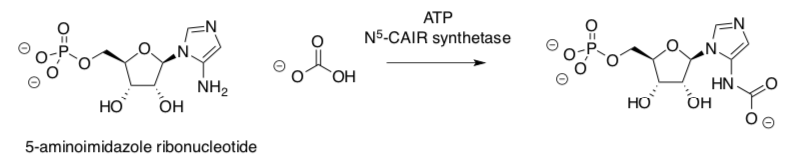
- Circle the atom in adenosine that has been added by the N5-CAIR synthetase- catalysed step.
The reaction proceeds via initial phosphorylation of bicarbonate.
- Provide a mechanism for this step.
- Explain, from a synthetic point of view, why this step is necessary.
The phosphate anhydride then reacts with the substrate to form the carbamate (or urethane) group.
- Provide a mechanism for this step.
The X-ray crystal structure of N5-CAIR synthetase is shown below (Firestine, Biochemistry2013, 52, 6559-6567). This structure was obtained in the presence of ADP and 5- aminoimidazole ribonucleotide (AIR). Computer software was used to place a carboxyphosphate ion in the location where phosphate was found in a previous crystal structure.
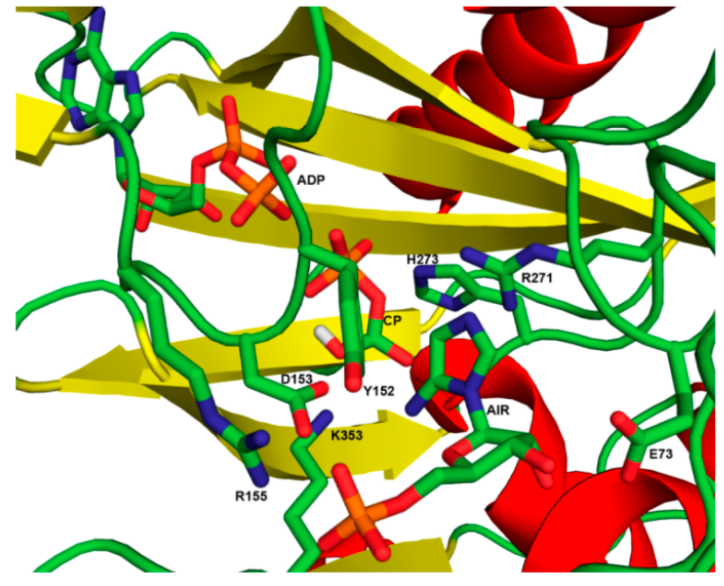
- Circle the ADP, the 5-aminoimidazole ribonucleotide, and the carboxyphosphate ion.
- Label the following secondary structures:
- An alpha helix
- A beta sheet
- A beta turn
- Propose possible binding interactions, in the format:
amino acid binds (what part) of (what molecule) via (what IMF)
- H273 binds___________________of___________________via___________________
- R271 binds___________________of___________________via___________________
- E73 binds ___________________of___________________via___________________
- K353 binds___________________of___________________via___________________
- R155 binds___________________of___________________via___________________
- D153 binds___________________of___________________via___________________
- Y152 binds___________________of___________________via___________________
Site-directed mutagenesis was performed. For example, in a mutant W25A, the 25th amino acid from the amino end of a wild protein was originally a tryptophan (W), but was replaced by an alanine (A) in the mutant.
The following kinetic parameters were obtained by plotting rate vs [HCO3- ] with [Enzyme] = 0.011 μmol mg-1.
- Fill in the blanks.
protein Original residue Mutant residue Vmax (μmol min-1mg-1) Km (mM) kcat kcat/Km wild 0.043 3.9 E73A 0.17 33 Y152F 0.05 2.8 D153A 0.15 15 R271Q inactive - - - R271K 0.0009 80 H273Q inactive - - - K353R inactive - - - - Which residue(s) appear(s) to be crucial for the function of the enzyme?
- Identify any mutants, if any, that resulted in
- Faster reaction but looser binding
- Faster reaction and tighter binding
- Slower reaction and looser binding
- Slower reaction but tighter binding
- In the presence of added phosphate ion, what do you expect would happen to the following parameters? Explain.
- Km
- Vmax
Analogous sets of data were obtained by plotting rate vs [AIR] and rate vs [ATP]. However, three different Km values were obtained from the plot of rate vs [HCO3-], rate vs. [AIR] and rate vs. [ATP].
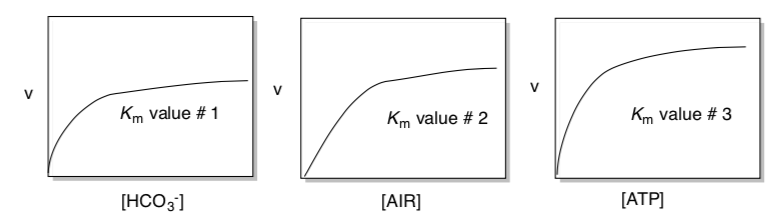
- Explain why.
- Draw the substrates in the binding site on the next page. Complete the mechanism using the protein residues for help.
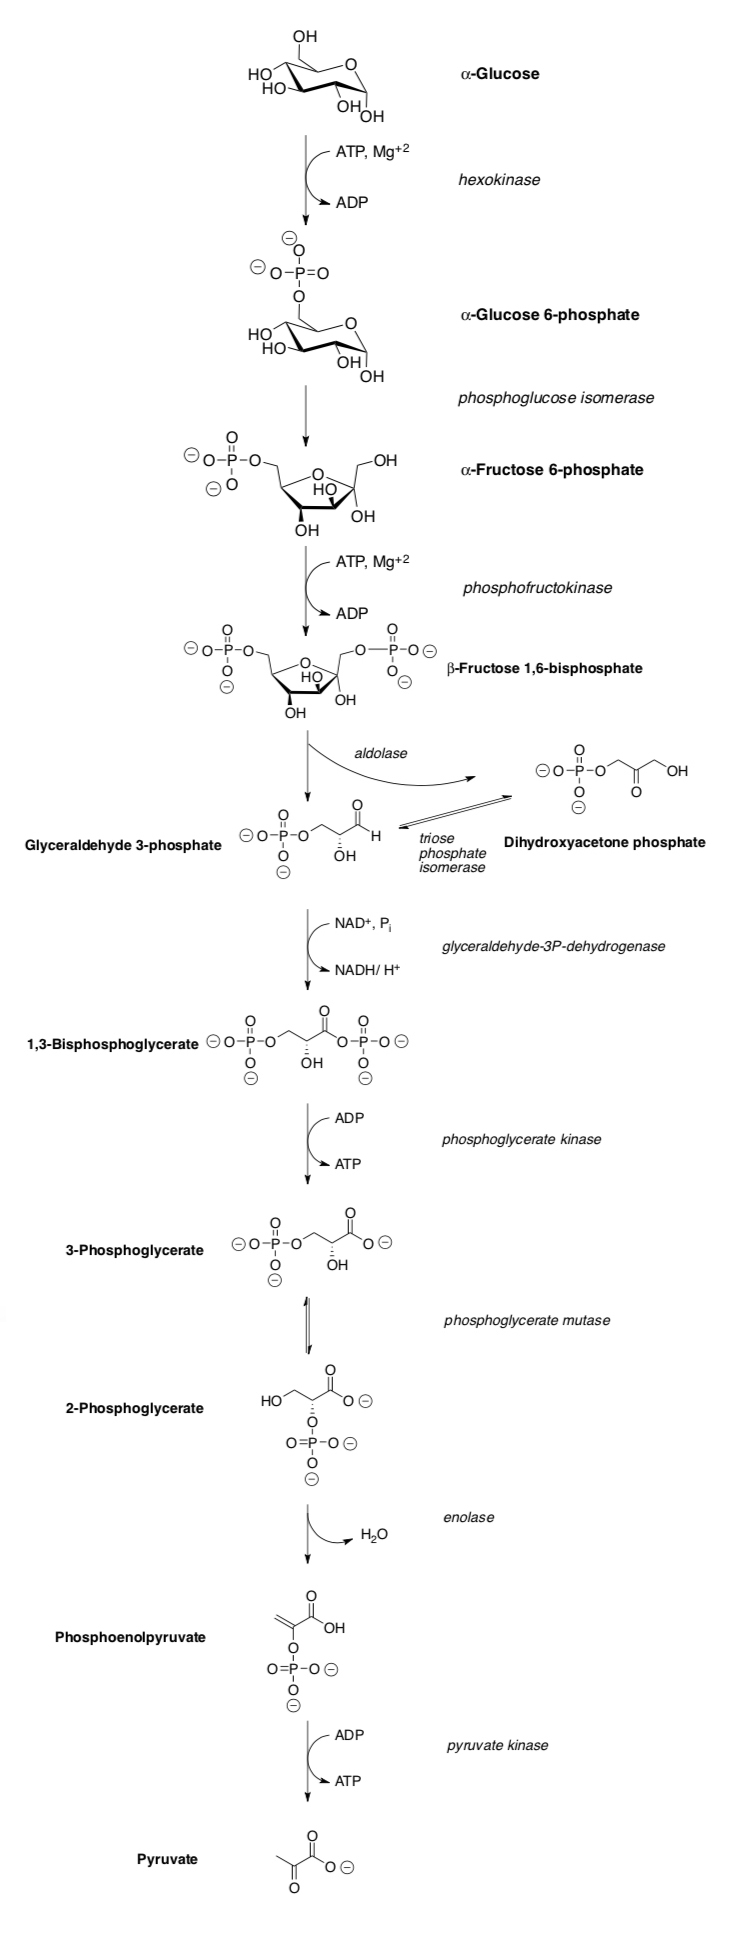
Glycolysis: A Kinetics Approach
In R1, we covered the mechanisms of the reactions in glycolysis as well as the thermodynamics and regulation. We neglected the kinetics!
Kinetics of Biochemical Pathways
Many metabolic pathways were covered in R1. Kinetics plays a big role in the control and integration of these pathways. Rate determining steps are a key feature in metabolic pathways.
Let’s look at the effect of a rate-determining step on the accumulation of pathway intermediates.
Note
These ideas are covered in your OWL homework. Take notes here while completing your homework problems.
- Draw metabolic Pathway A with five molecules labeled 1 to 5.
- If the step from 2 to 3 is the rate determining step, what intermediate will accumulate?
- Draw a potential energy diagram for this pathway.
- What determines how fast substance 5 is made? What might cause this rate to change?
The rate of formation of substance 5 is called the metabolic flux of pathway A. Consider another pathway, called pathway B, which operates from molecules 5 to 1. It is a different pathway because it utilizes different enzymes for some of the steps even though the intermediates are identical. The metabolic flux of pathway A is now complicated by the fact that molecule 5 is the starting material of pathway B.
- Describe how the presence of Pathway B might affect the flux of Pathway A.
Isoenzymes:
Note
These ideas are covered in your OWL homework. Take notes here while completing your homework problems.
Isozymes (also known as isoenzymes) are variants of the same enzyme. While isozymes catalyze the same chemical reaction, they differ in specific amino acid substituents.
- How might a change of a valine to an aspartic acid change the structure?
- What types of features of an isoenzyme permit one isoform to be inhibited and not another?
Isozymes display different kinetic parameters (e.g. different KM values), or different regulatory properties. The existence of isozymes permits the fine-tuning of metabolism to meet the particular needs of a given tissue.
- Activity of the mutant enzyme doubled when the substrate concentration was increased from 200 uM to 400 uM. Activity of the wild-type enzyme increased only 10% when the substrate concentration was increased from 200 uM to 400 uM. Which form of the enzyme has higher KM value? Explain your reasoning
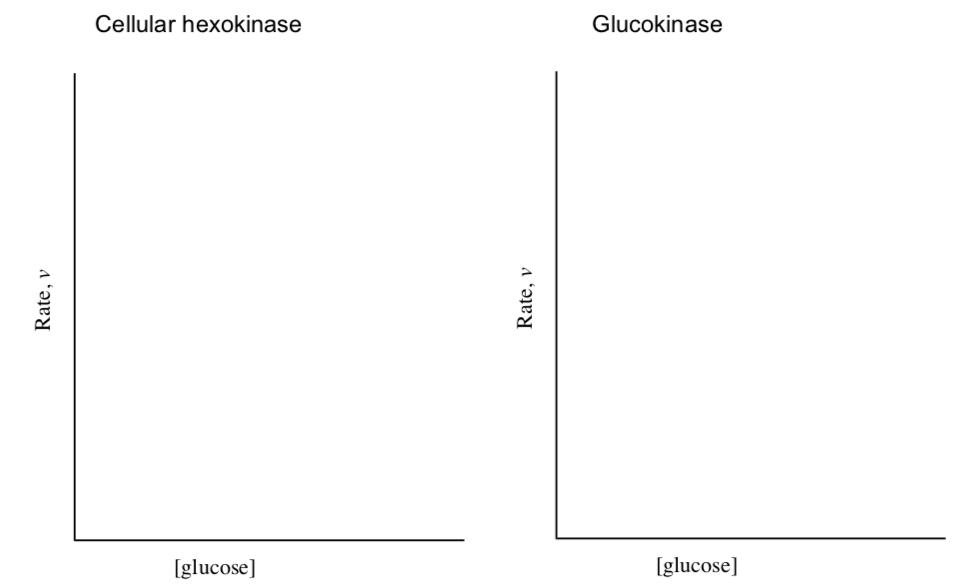
Hexokinase Regulation
| Features | hexokinase isoform (cellular) | hexokinase isoform (liver cells) (aka glucokinase) |
| Km for sugars | low (0.1 mM) | very high (10 mM) |
| Specificity | broad | broad |
| Control | inhibited by glucose-6- phosphate | no inhibition by glu-6-P |
| Concentration dependence | [glucose] >>> Km; intracellular [glu] ~5 mM | sigmoidal concentration dependence on glucose |
- What type of inhibition do you expect from Glu-6-P?
Competitive | Non-competitive | Uncompetitive
- Convert the information from this table into two graphs rate vs [glucose].
– Assume the same Vmax.
– Include curves with and without the presence of glucose-6-phosphate.
Hexokinase Isozymes
The role of the liver is to maintain the [glucose] circulating in the blood at constant levels. This is necessary so that organs such as the brain that use primarily glucose as their energy source have a steady source of ATP.
- Using your graphs of the rates of hexokinase and glucokinase, discuss why glucokinase behaves differently than the hexokinases in other cells.
- Why is Glu-6-P used as an inhibitor?
- Hexokinase is also inhibited by ATP (its substrate). Why?
Regulation of Phosphofructokinase
- Draw the reaction of PFK.
- Show the mechanism of this reaction.
- What step of glycolysis is this?
- How is the reaction of PFK-1 circumvented in gluconeogenesis?
ATP is a substrate and an allosteric inhibitor of PFK-1.
- Explain the velocity vs [ATP] curve for PFK-1.
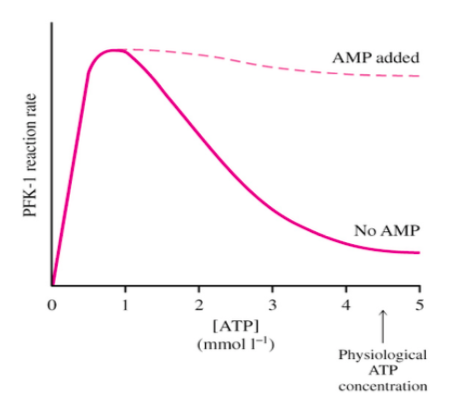
Changes in AMP and ADP concentrations can control the flux through PFK-1. The dashed line shows the response when AMP is added.
- What is the role of AMP?
None Competitive Inhibitor Allosteric Activator Allosteric Inhibitor
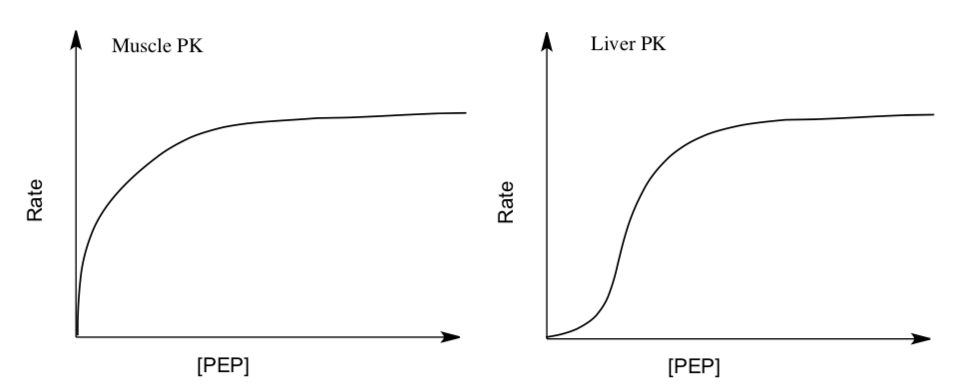
Regulation of Pyruvate Kinase
- Draw the reaction of pyruvate kinase.
- Show the mechanism of this reaction.
- What step of glycolysis is this?
- Explain the different response to the substrate. What does this tell you about the different enzymes?
- ATP, Acetyl CoA (first reactant of TCA) and long-chain fatty acids all signal that energy is _________ (available or needed).
- When abundant energy is available, glycolysis should _____________.
- Thus, high [ATP] allosterically ____________the affinity of PK1 for PEP.
The liver form (L form) but not the muscle form (M form) is also subject to further regulation by phosphorylation in response to Glucagon signals.
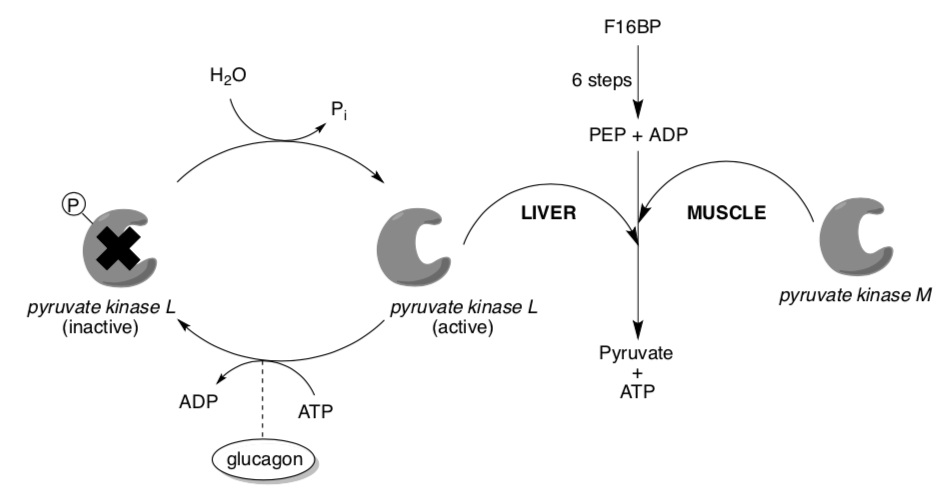
- The liver isoform is [ down-regulated / up-regulated ] (circle one) by glucagon.
When pyruvate kinase is inhibited by phosphorylation (which occurs in the fasting state, via glucagon), phosphoenolpyruvate is prevented from being converted to pyruvate. Instead, it is converted to glucose in a series of gluconeogenesis reactions that are mostly (but not exactly) the reverse sequence of glycolysis.
The glucose thus produced is expelled from the liver, providing energy for vital tissues in the fasting state.
- What is the metabolic advantage of having liver isozyme of PK regulated by glucagon?
Use the rate vs [substrate] plots below to understand the different response to Fructose-1,6-Bisphosphate (F1,6BP).
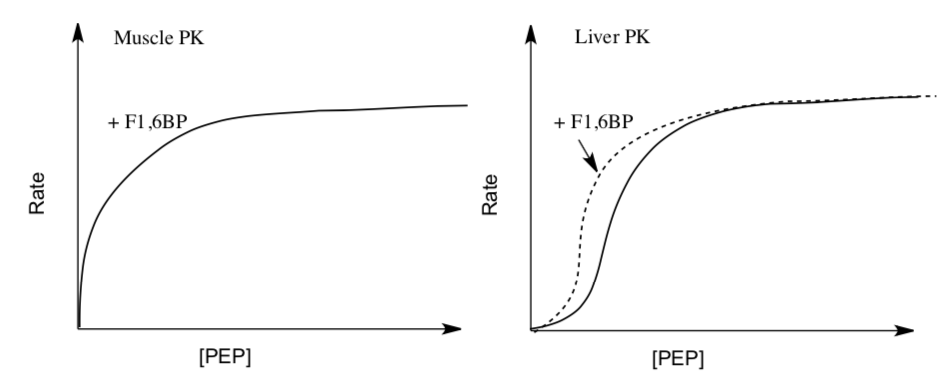
- How does F1,6BP affect Muscle PK?
Not at all | Competitive Inhibitor | Allosteric Activator | Allosteric Inhibitor
- How does F1,6BP affect Liver PK?
Not at all | Competitive Inhibitor | Allosteric Activator | Allosteric Inhibitor
- Why does muscle and liver versions of PK need to have different responses to F1,6BP?
- Why is the liver PK isoform up-regulated by F1,6BP?
Diffusion Controlled Kinetics
Diffusion
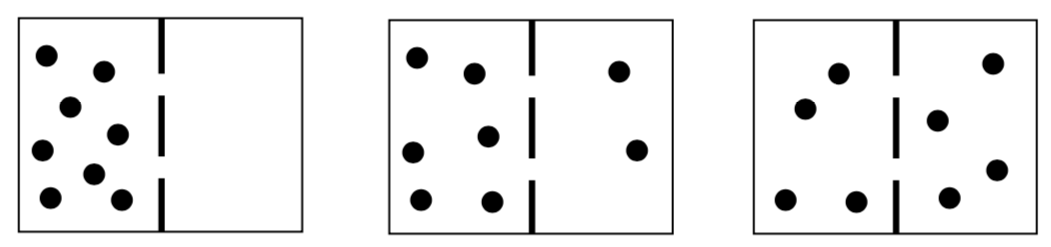
Diffusion is a random mixing phenomenon that occurs without external sources. In other words, the molecules/atoms will spread out through a solution due to their random motion propelled by thermal energy.
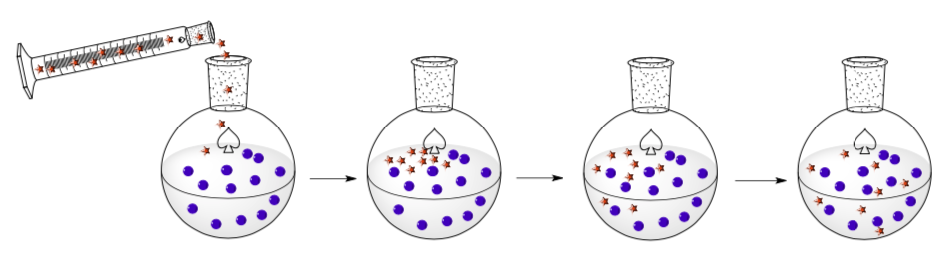
- In your own words, describe what is happening in these pictures.
Diffusion Control
Diffusion-controlled (or diffusion-limited) reactions are reactions that occur so quickly that the reaction rate is the rate of transport of the reactants through the reaction medium (usually a solution).

- What is the rds in a reaction of this sort?
- Write a rate law for this reaction.
- Draw a reaction progress diagram for this reaction.
Factors affecting Diffusion
Diffusion as the rate-limiting step is more likely in solution where diffusion of reactants is slower due to the greater number of collisions with solvent molecules.
- Ionic reactants will diffuse (faster or slower) in aqueous solution.
- A nonpolar compound will diffuse (faster or slower through aqueous solution.
- A more viscous solvent will (Increase or decrease) the diffusion rate and the overall reaction rate will (increase or decrease).
- Using your understanding of Collision Theory and diffusion, explain in your own words why a reaction could be slowed down by the presence of solvent.
The surrounding solvent molecules can create a "solvent cage" which inhibits the separation of the reactant molecules.
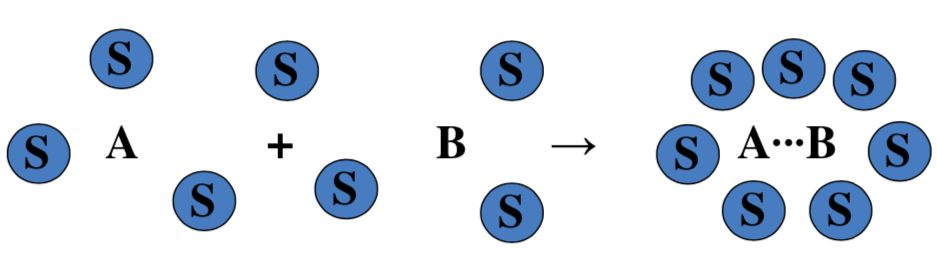
This solvent "cage effect" provides the opportunity for the molecules to undergo many more collisions before finally either reacting or diffusing away from each other.
- The cage effect tends to ( increase or decrease) the reaction rate by (increasing or decreasing ) the opportunity for reactant molecules to collide with the required energy and/or orientation to react.
- How does an enzyme compare to this cage effect?
One classical test for diffusion as the rate-limiting step is to observe whether mechanical stirring or agitation affects the rate of reaction.
- Which of the following reactions would be more greatly affected by stirring?
- Explain.
Reactions where products form rapidly are most likely to be limited by diffusion control. Heterogeneous catalysis and enzymatic catalysis are often under diffusion control.
- Draw a picture of heterogeneous catalysis and explain why diffusion is often the limiting step for these reactions.
Summary of Diffusion
- Define diffusion:
- Diffusion occurs from areas of [ high / low] concentration to areas of [ high / low] concentration.
- Using Collision theory, explain why diffusion is important to understanding reaction rates.
- List some factors that can affect the rate of diffusion:
Passive, Facilitated and Active Transport
A membrane can act as a barrier between a cell and its environment, or between distinct compartments of a cell. However, the normal processes of a cell require that molecules move across membranes. Most of this transport, but not all, is protein- mediated and very selective.
Some mechanisms of transport require energy, others do not.
Thermodynamics of diffusion:
- The following pictures are of solute molecules in two chambers separated by a permeable membrane. If the following pictures were a movie, in what direction would they progress (i.e. order the following pictures)?
- Why did you number the pictures the way you did?
- What thermodynamic principle is probably driving this reorganization of solute molecules?
- Passive transport is thermodynamically favored, so which way do the pictures progress in passive transport?
- Active transport requires energy, which can be derived from a variety of sources including ATP hydrolysis, light, and concentration gradients. In which way do the pictures progress in active transport? Why?
The rate of diffusion is determined by the solute concentration gradient, and it is directly proportional to the concentration difference of the solute across the membrane.
Permeability and Osmosis:
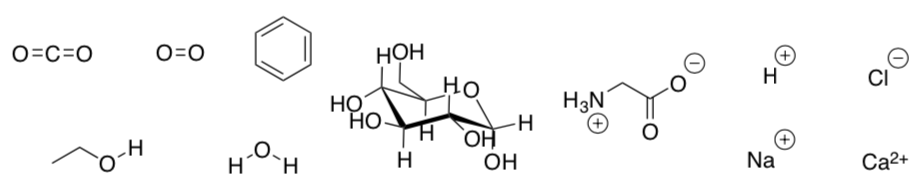
Only small non-polar molecules and gasses can cross the cell membrane.
- Circle all the items (shown below) that can be passively transported across a cell membrane:
Biological membranes are permeable to water but not to ions or small polar organic molecules. Due to this difference in permeability, water moves across a membrane in order to even out the molarity. This passive transport of water is called osmosis.
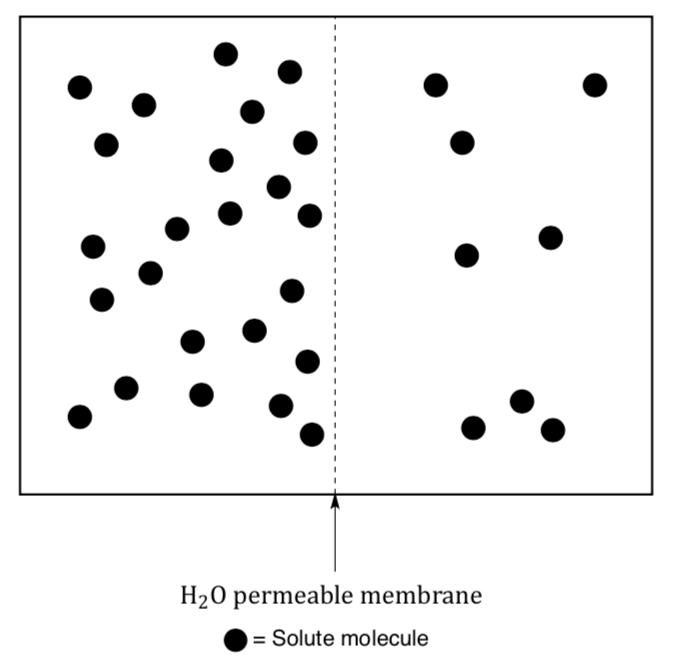
- In the diagram above indicate the direction of water movement.
- Label the compartments as either hypertonic (higher concentration of solute) or hypotonic (lower concentration of solute)
Passive Transport:
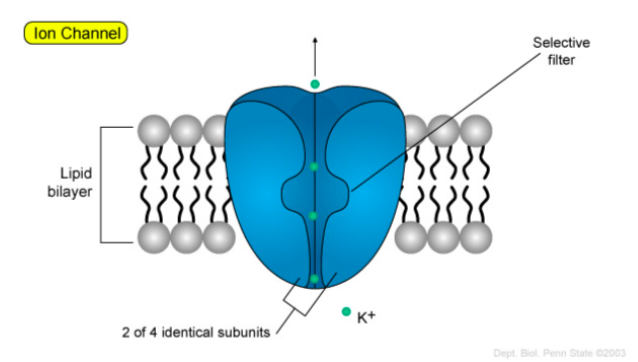
Obviously, ions and other molecules still need to get across a membrane. Ions can be pass through membranes via ion channels or by facilitated diffusion.
Below is an example of an ion channel.
Adapted from:
https://wikispaces.psu.edu/display/2...tive+Transport
Ions can flow in this channel in either direction. An ion channel is extremely selective for the ion allowed through (i.e. distinct channels for each ion).
- What types of amino acids might line the openings of this potassium ion channel?
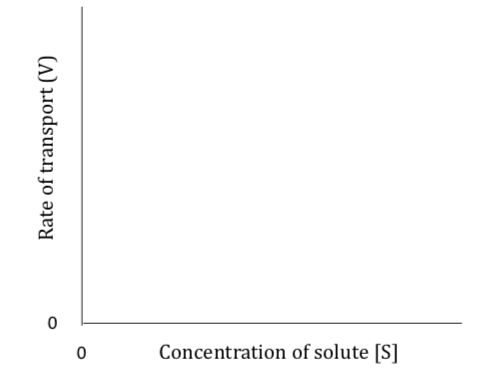
Molecules and ions that can be passively transported across a membrane follow the same type of kinetics for transport. Passive transport is analogous to an uncatalyzed unimolecular chemical reaction.
- In the diagram below illustrate the relationship for the rate of passive transport and solute concentration.
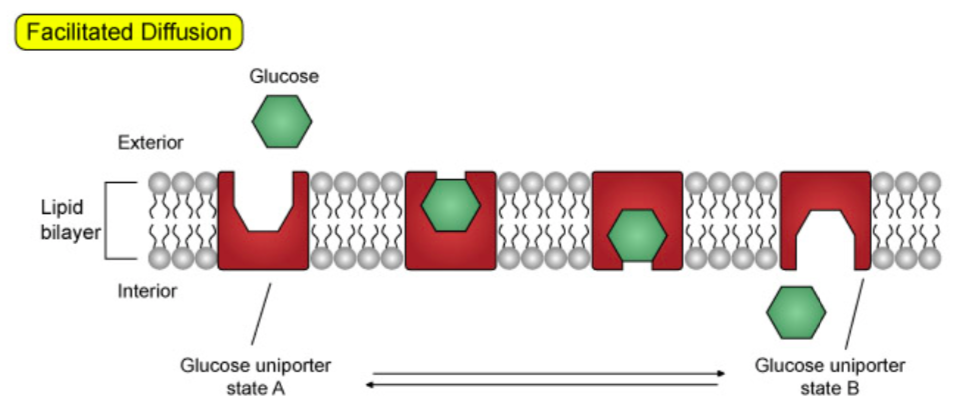
Facilitated Transport:
Larger molecules (such as glucose) and some ions are moved across membranes by facilitated transport. An illustration of this is the glucose carrier protein (GLUT1), which is found on the cell surface of erythrocytes (red blood cells).
Adapted from:
https://wikispaces.psu.edu/display/2...tive+Transport
A facilitative transporter moves its substrate from one side of the membrane where the substrate concentration is high to the other side of the membrane where the concentration is lower.
For example, in most body cells, after glucose is transported into the cell by the glucose transporter, it is converted to glucose-6-phosphate, which can then participate in various metabolic pathways of the cell. Glucose-6-phosphate is not a substrate of the glucose transporter.
- Using Le Chatelier’s Principle, explain how this affects the rate of diffusion across the membrane.
Kinetics of Facilitated Diffusion
Facilitated diffusion, mediated by a carrier protein, is more rapid than simple diffusion (just like a catalyzed reaction is faster than an uncatalyzed reaction).
- This should look familiar. What happens to the rate as [S] is increased?
- What happens to the rate at very high [S]?
- In the diagram below illustrate the relationship for the rate of facilitated transport and solute concentration.
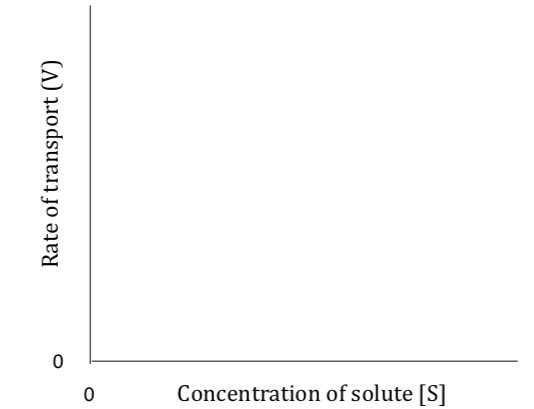
There is a maximal rate of transport (Vmax) reached at saturation, where every molecule of carrier protein is engaged in transport and the addition of more solute does not increase the rate of transport.
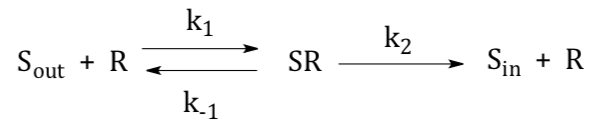
We can use Michaelis-Menten Kinetics to model this:
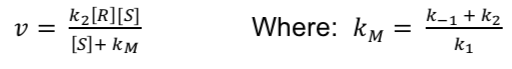
- Under what conditions is Vmax obtained? Rewrite the equation to reflect these conditions.
It is important to note that the direction of transport (whether passive or facilitated transport) is driven by the concentration gradient across the membrane. Transport will always be from a high concentration to a low concentration.
Active Transport:
- Active transport is defined as the movement of solute against an electrochemical gradient; therefore, by definition, it is an (endergonic / exergonic) process.
- We have dealt with many unfavorable reactions in this and the previous class. How can an enzyme overcome an unfavorable reaction?
Many of the carrier proteins involved in active transport are referred to as pumpsbecause analogous to a water pump (which requires energy to crank the handle up and down to make water flow), transport pumps require energy to move solutes across membranes.
- Looking at the models below, what are some ways that pumps are able to work against a concentration gradient?
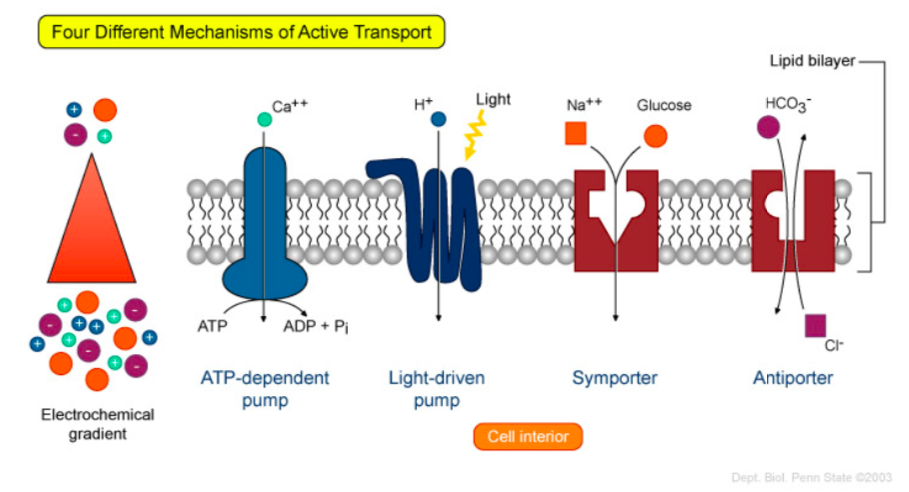
Adapted from: https://wikispaces.psu.edu/display/2...tive+Transport
- In all cases, some form of energy is required to drive the transport of solutes. The free energy released must be (greater / less) than the free energy required to move a solute against its electrochemical gradient.
Summary of Membrane Transport
- Describe these types of membrane crossings. Include the type of molecules and the thermodynamics involved.
- Permeability through the membrane
- Osmosis
- Passive Transport
- Facilitated Diffusion
- Active Transport
- Compare the rate of transport as solute concentration increases for an active transport process vs passive transport process. Include graphs.
Application Problem
- Lactose is a disaccharide found in milk.
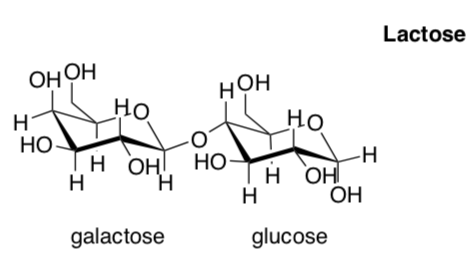
Many adults throughout the world get sick from drinking milk because they cannot digest lactose. Lactose intolerance varies markedly among various human populations.
When someone who is lactose intolerant ingests milk, the lactose accumulates in the lumen of the small intestine because there is no mechanism for uptake of the disaccharide. This causes abdominal distension, cramping, and watery diarrhea.
- Why can't lactose diffuse across the membranes of the intestinal epithelial cells in the absence of a carrier-mediated uptake system?
- Why does the accumulation of sugar (or any solute) in the intestinal lumen cause an influx of water that leads to watery diarrhea?
Adults who can drink milk can do so because of the enzyme lactase that is located on the outer surface of epithelial cells lining the small intestine. Lactase hydrolyzes lactose into glucose and galactose which can cross the epithelial cells, and therefore do not cause illness.
- Based on your knowledge of transport across cell membranes, propose a mechanism by which galactose is transported into the intestinal epithelial cells. Include a diagram of your mechanism.
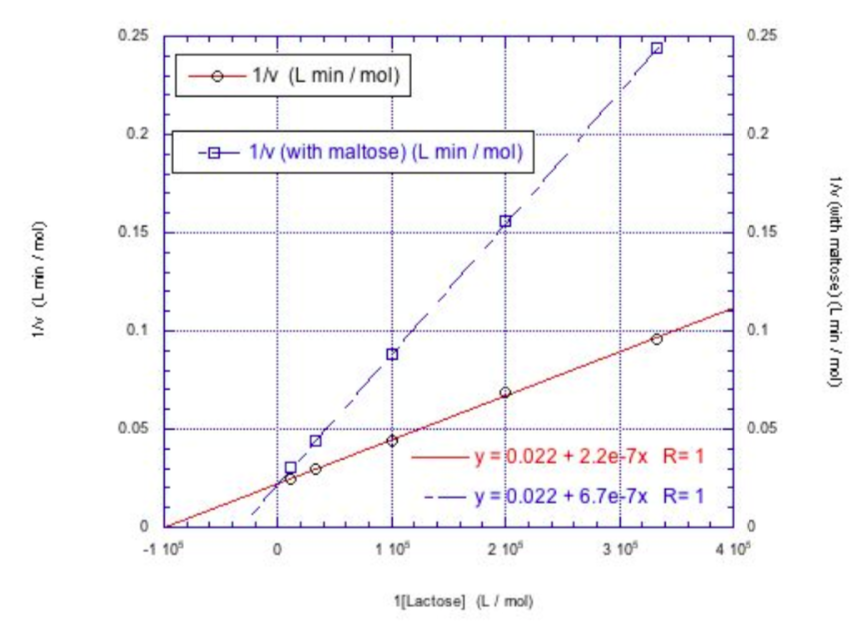
Maltose, another common disaccharides, is NOT cleaved by lactase, and furthermore, maltose appears to have some kind of inhibitory effect on lactase's ability to cleave lactose.
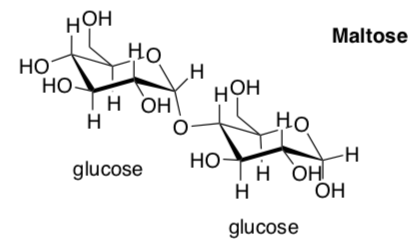
- Is maltose a more likely candidate for competitive or noncompetitive inhibition of lactase? Explain.
Use the Lineweaver-Burke plot below for lactase both with and without maltose.
- What type of inhibitor is maltose? How do you know?
- What is the Vmax for the enzyme without the inhibitor?
- What is the Km for lactose?
Diffusion Controlled Enzymes
Diffusion Controlled Enzymes – How fast can an enzyme go?
Enzymes have a remarkable rate enhancement. Most enzyme catalyzed reactions operate at millions per second with transition state affinities as high as 1024 M.
Wolfenden & Snider (2001). Acc. Chem. Res. 34, 938-45. Radzicka, A. and Wolfenden, G. (1995). Science 267 (5194), 90-93.
Turnover number reflects the max catalytic activity.
- At what substrate concentration, does Vmax occur?
[S] = Km
[S] >> Km
[S] << Km
- At this concentration k2 = kcat. Write an equation to represent kcat at this concentration.
- Draw a graph of v (rate) vs [S] for a saturated enzyme.
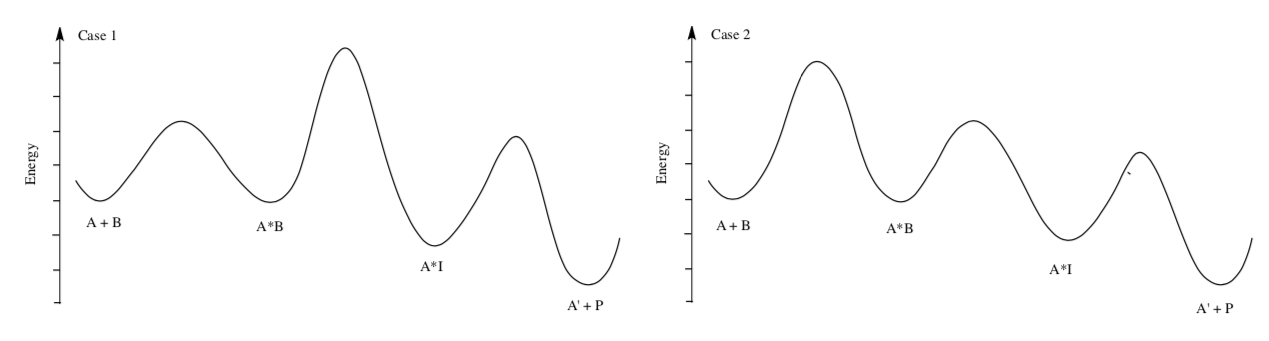
If the enzyme system is not under saturation conditions, then diffusion (and binding) may play a bigger role. If enzyme is saturated, kcat is more important.
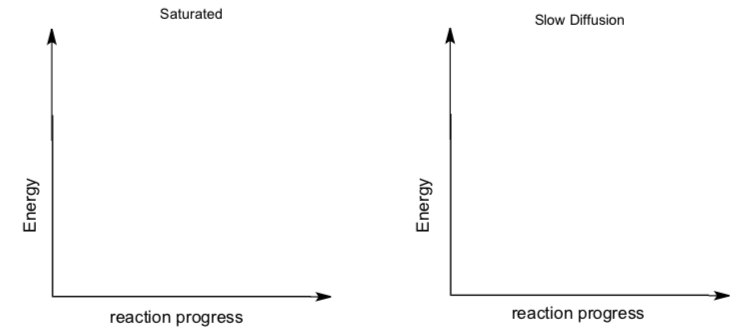
- Draw reaction progress diagrams for these two scenarios. each.
Under physiological conditions, [S] usually not at a high enough level to reach Vmax.
- Rewrite the Michaelis-Menten equation above to represent physiological conditions:
However, if the enzyme has a high kcat/Km every encounter will result in a reaction then it will be controlled by the rate of diffusion.
- Rewrite (\(\ kcat \over km\)) in terms of k1, k2 and k-1
- If k2 is very high (ie. k2 >> k-1), what does (\(\ kcat \over km\)) approach?
- Why must k1 always be greater or equal to (\(\ kcat \over km\)) ?
If every collision results in formation of an enzyme-substrate complex, diffusion theory predicts that kcat/KM will attain a value of about 108 to 109 (mol/L)-1s-1. The enzymes carbonic anhydrase, fumarase, and triose phosphate isomerase actually approach this limit.
Molecular encounter limits
Review: Summarize Collision Theory.
- Define Collision Theory.
- How do the following factors affect reaction rate?
- Temperature:
- Pressure:
- Concentration:
- Entropy
- Draw a plot that shows the concentration of a reactant vs time.
- Draw a plot of reaction rate (Moles/s) vs time.
Theoretical calculations indicate that diffusion/collision rates = 107-9 M-1s-1
Increasing the Odds of Collision
Enzymes have two methods for overcoming the molecular encounter limits.
- Decrease degrees of freedom
If the target is big, then the substrate is more likely to find it. If the substrate moves in fewer dimensions, then the likelihood of collision increases.
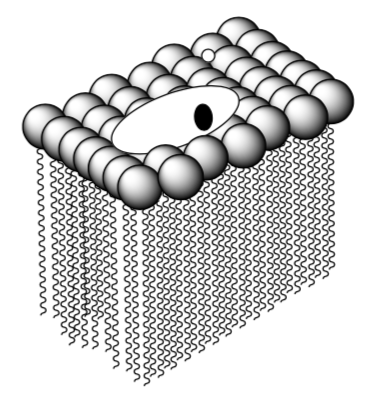
- Rank the rate at which these substrates find their target (1=fastest; 3=slowest):
- Substrate finding an enzyme within a cell (Spherical)
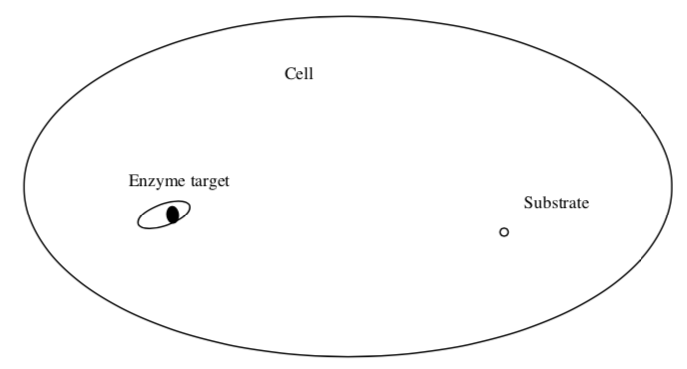
- Substrate finding membrane bound receptor/enzyme (Planar)
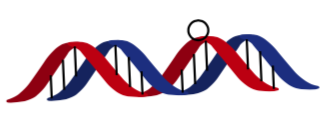
- Protein finding the correct location on a strand of DNA (Linear)
- Substrate finding an enzyme within a cell (Spherical)
- With this understanding of the effect of dimensionality on collision rate, explain the following statement:
“the E. coli lac repressor protein locates its specific binding site (the operator) on a long DNA chain several orders of magnitude faster than expected from a straightforward estimate of diffusion-limited rate in solution”
- Rank the rate at which these substrates find their target (1=fastest; 3=slowest):
- In the 3D cell, enzymes can overcome the diffusion problem using steering and gating.
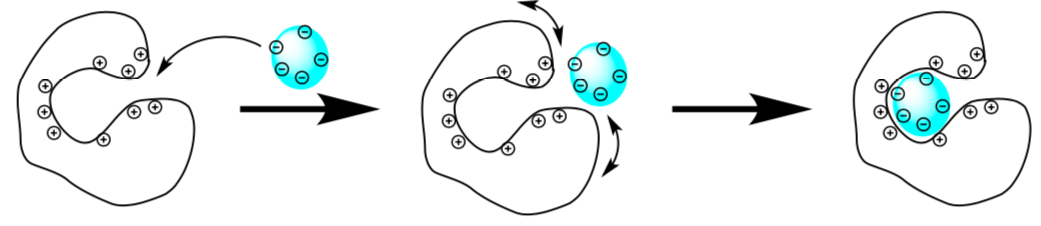
- Based on this picture, define
- Steering:
- Gating:
- What is the driving force behind gating and steering?
- Based on this picture, define
Summary of Diffusion Controlled Enzymes
- What is the [S] in most physiological settings?
- What is the rate determining step for efficient enzymes under physiological conditions?
- How does the Michaelis-Menten equation change for saturating conditions vs physiological conditions?
- If k2 is very high (ie. k2 >> k-1), what does (\(\ kcat \over km\)) approach?
- What are two methods for an enzyme to overcome diffusion rates?