
Some 'bad' GC chromatograms
- Page ID
- 61095
Nico Vonk, Avans+, Breda, The Netherlands
Abstract
This chapter shows a series of GC chromatograms with some common problems and their solutions.
Level: Basic
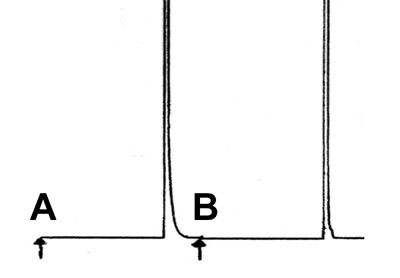
Tailing
You see the result of two manual split injections of some methane (natural gas) on a standard apolar column.
What could be the reason for the tailing peak in result A?
Answer?
Base Line Draft
A sample of high boiling analytes was separated on a thin film apolar column, in combination with on-column injection and temperature programming.
What is your idea about the base line drift during this run? How would you solve this problem?
Answer?
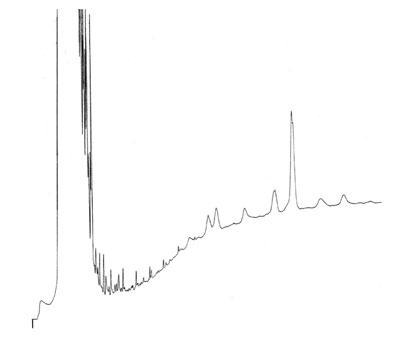
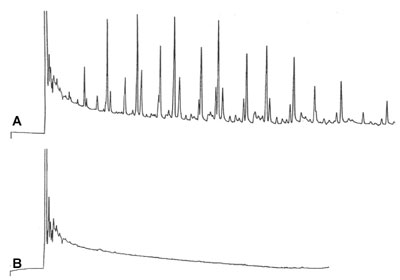
'Strange' Baseline
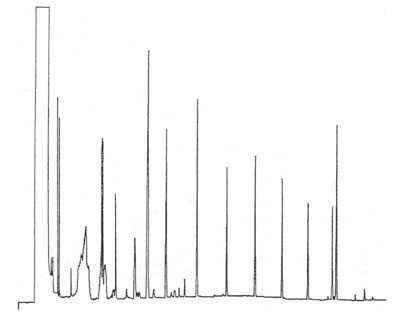
This chromatogram is a temperature programmed analysis of a wide range of n-hydrocarbons. The injection was splitless on a medium polar column (cyano – phenyl – methyl siloxane). The run was performed after a cooling down period overnight of the oven.
What is your explanation for the strange baseline in the baseline in the second part of the chromatogram?
Answer?
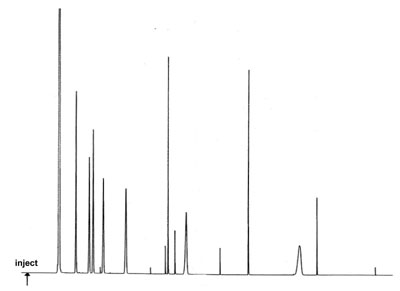
Very Sharp Peaks on the Baseline
A GC analysis under optimal conditions gives a number of very sharp peaks on the baseline in the chromatogram.
What could be the reason for this problem? What is your action program here?
Answer?
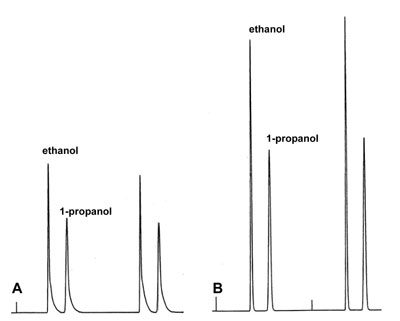
'Poor' Peaks
An aqueous sample of a mixture of ethanol and propanol is injected manually by two different analysts in duplo on the same system under identical conditions. Repeatability of both injections was acceptable. The results in A are poor, B is fine.
What could be the reason of the poor peaks of analyst A?
Answer?
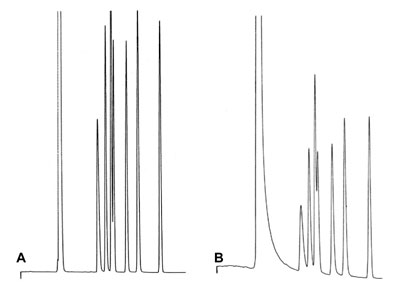
Poor Performance
Chromatogram B shows poor solvent peak shape and loss in efficiency compared to chromatogram A. The same column in both cases after installation of this column again by your colleague……..
What Could be the reason for this Poor Performance
Answer?
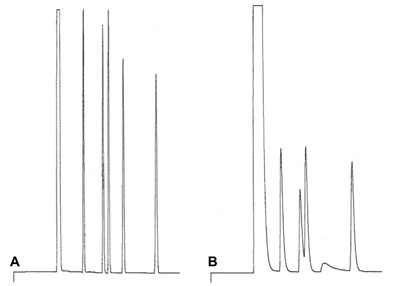
Poor Chromatogram
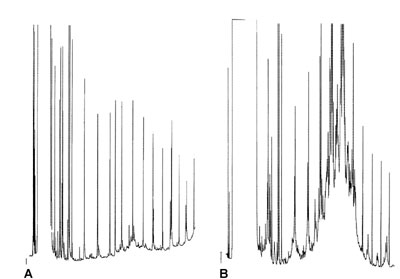
This sample contains both polar (alcohols) and neutral components and is separated on a non polar column. A is the expected result. After replacement and installation of a brand new column, result B is obtained.
What could be the reason of this poor chromatogram B?
Answer?
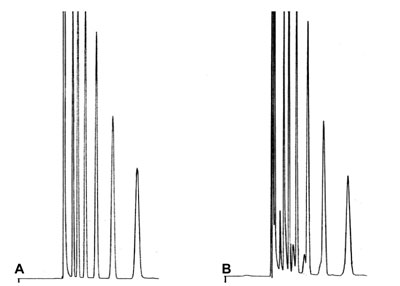
Injection Problem? Doubling Peaks
Chromatogram A is the normal result result of a manual direct injection on a wide-bore column. Chromatogram B is a duplo injection, but looks different.
What went wrong in injection B?
Answer?
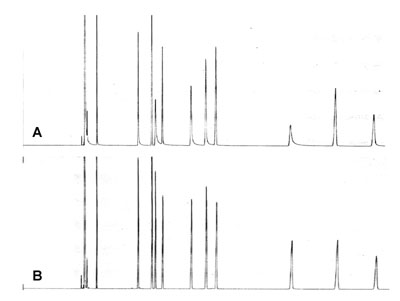
Injection Problem
Chromatogram B is the normal result of a manual direct injection on a wide-bore column. Chromatogram A is a duplo injection, but it looks different.
How can you explain the differences in peak shape of some of the peaks in chromatogram A?

Answer?
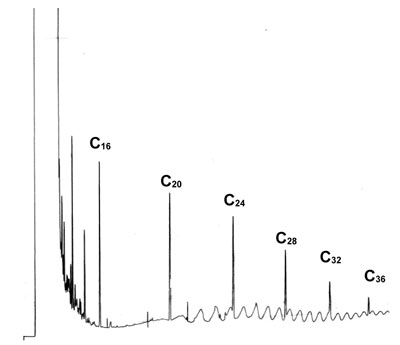
Disturbed baseline
This chromatogram is a splitless injection of a standard with a wide range of hydrocarbons (C10 – C36). The sample solvent is 70% / 30% methanol / water and the initial column temperature is 70°C. The column is a 5% phenyl – 95% methyl siloxane stationary phase. Final temperature was 300°C.
What could be the reason for the distributed baseline just after the solvent peak?
Answer?
Baseline Drift?
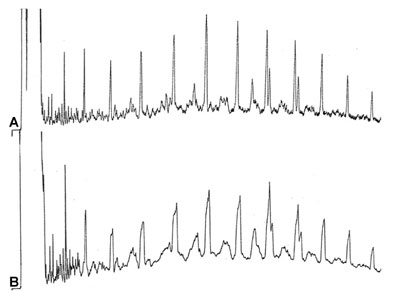
Chromatogram A is the correct result of the separation of a complex mixture, injected splitless with a column temperature program of 55°C to 275°C at 10°/min. A and B have same mixture and column.
What would you do if your result looks like chromatogram B?
Answer?
Poor Peakshapes
Both chromatograms are made with on-column injection (5 μL) of a mineral oil type of sample (diluted) on a good, apolar column.
How can you explain the poor peakshapes in result B?
Answer?
Bad Performance
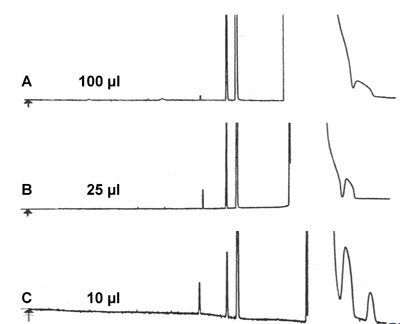
Chromatograms A, B and C are runs of quality control of impurities in 99.9% pure 1-buteen. In all the chromatograms the peaks after the main component are very poor in shape and separation. GC conditions: Column : Al2O3/Na2SO4 PLOT, 50m x 0.32 mm (L x ID) Temperature : 110°C Carrier gas : N2, 11 kPa Detector : FID, 200°C
What is a possible reason for the bad performance of this separation just behind the major peak?
Answer?
'Strange' Baseline
A is recorded after a splitless injection and Electron Capture Detection (ECD). Chromatogram B is made under the same conditions and is the injection of the sample solvent only (blank sample).
What is the reason for the strange baseline?
Answer?
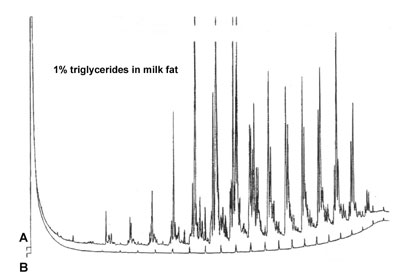
'Ghost Peaks'
Run B is a blank sample run, where only the pure sample solvent is injected. One of the previous runs is chromatogram A, the separation of triglycerides in milk fat at a wide temperature program of the column. Injection was split at a ratio of 1 : 10.
What can be the reason for the "ghost" peaks in chromatogram B?
Answer?
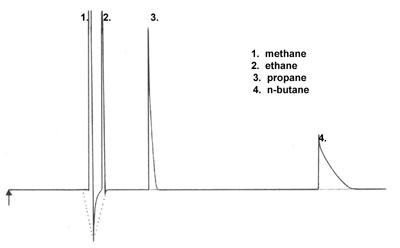
Negative Peak
Low hydrocarbons are separated under the following conditions:
- Column : Al2O3/Na2SO4 PLOT, 50 m x 0.53 mm (L x ID)
- Temperature : 70°C, 1 min + 5°C/min ® 190°C
- Injector : Gas sampling valve, 200 µl, direct
- Detector : TCD Carrier gas : Helium, 9.3 ml/min
- Sample : C1, C2, C3 en C4 in nitrogen (conc. ± 3 vol% each)
Can you explain the poor peak shape for propane and butane? What is the origin of the negative peak between peaks 1 and 2?
Answer?
Poor Peak Shape. Buy New Column?
Based on the poor peak shape in chromatogram A a new column was ordered and installed. Chromatogram B is the result as expected with this new column. Column A was used for some period of time for this application, using splitless injection.
Would it be possible to improve the performance of column A without buying a new one?
Answer?