6.5: Q-NMR Drylab
- Page ID
- 77866

KHP T1 relaxation times
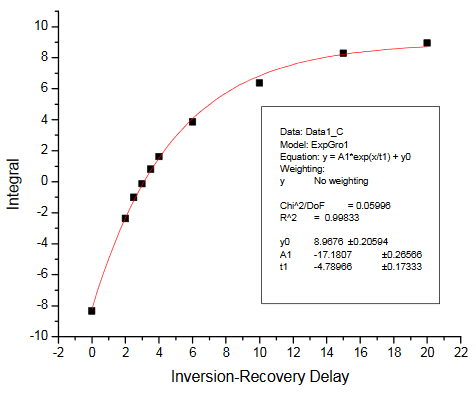
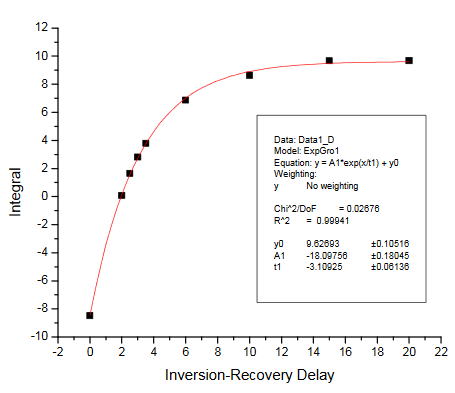
There are two ways of getting the T1 relaxation times for the KHP resonances. The simplest way is to have students estimate the null times for the two resonances in the inversion-recovery spectra provided. Selected spectra from the dry lab data set were used to make the figure in the Practical Aspects section of the module. Alternatively, students can process the spectra and measure resonance integrals for each peak. These can be plotted vs. the relaxation delay and fit to determine T1. The integrals we obtained are summarized in the Table below. The fits obtained using Origin 7.5 are also provided. We obtained T1 values of 4.79s and 3.11s for the KHP resonances at 7.75 and 7.61 ppm, respectively.
The concentration of KHP in the stock solution is determined from the mass of KHP.
\[\mathrm{Mass\: KHP = 0.3533\: g - 0.2219\: g = 0.1314\: g}\]
\[\mathrm{[KHP] = \dfrac{0.1314\: g}{204.22\: g/mol}\times\dfrac{1}{0.005\: L} = 0.1287\: M}\]
| Delay | Integral R1 (7.75 ppm) | Integral R2 (7.61 ppm) |
|---|---|---|
| 0 s | -8.34 | -8.48 |
| 2 | -2.38 | 0.07 |
| 2.5 | -1.01 | 1.65 |
| 3 | -0.14 | 2.81 |
| 3.5 | 0.8 | 3.78 |
| 4 | 1.62 | 4.57 |
| 6 | 3.87 | 6.86 |
| 10 | 6.37 | 8.63 |
| 15 | 8.28 | 9.67 |
| 20 | 8.95 | 9.65 |
Inversion-recovery plot for R1
Inversion-recovery plot for R2
Malic Acid Standard Solution Determination
From the mass of malic acid weighed and the solution volume, we can calculate the concentration of this standard.
\[\mathrm{Mass\: of\: MA = 0.3324\: g - 0.1897\: g = 0.1427\: g}\]
\[\mathrm{[MA] = \dfrac{0.1427\:g}{134.09\:g/mol}\times \dfrac{1}{0.005\:L} = 0.2128\:M}\]
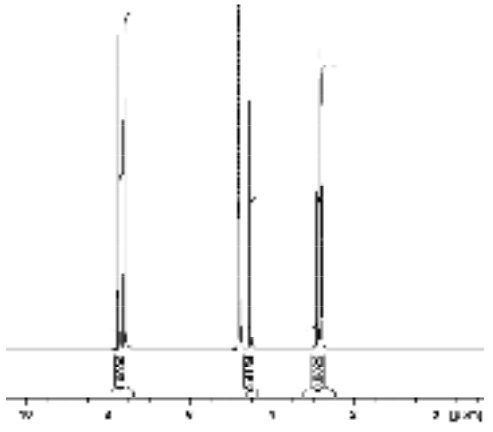
Since equal volumes of the KHP and malic acid were mixed to prepare this solution, the dilution factor can be neglected and the concentration of malic acid calculated as shown below. Here we used the integral of the resonances at 2.82 and 2.89 ppm corresponding to the inequivalent malic acid CH2 protons.
\[\mathrm{[MA] = [KHP] \times \dfrac{Int_{MA}}{N_{MA}} \times \dfrac{N_{KHP}}{Int_{KHP}} = 0.1287\:M \times \dfrac{0.8322}{2} \times \dfrac{4}{1.000} = 0.2142\: M}\]
Spectrum of malic acid standard solution containing KHP
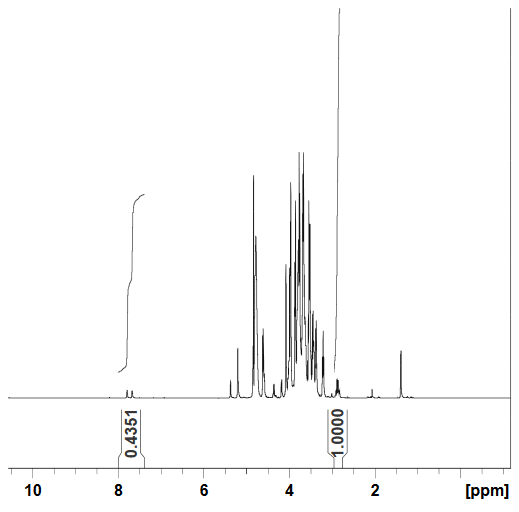
Determination of Malic Acid in Apple Juice
The concentration of malic acid can similarly be calculated in an apple juice sample. Here though we will need to take into account the dilutions performed.
The KHP was diluted twice in preparing this solution. First it was diluted by half with D2O, and subsequently 100 µL of was further diluted by addition to 900 µL of apple juice for a total volume of 1 mL. The KHP concentration in the apple juice sample can be calculated as shown below. Note that the volume added in making the pH adjustment to 1.35 is not important since both the KHP and the malic acid will be diluted by the same amount. This pH adjustment is necessary to resolve the malic acid resonances from those of the other apple juice components. Because of the simplicity of the malic acid standard spectrum, pH adjustment is not needed.
\[\mathrm{[KHP]_{juice} = [KHP]_{stock}\times\dfrac{1}{2}\times\dfrac{100}{1000} = 0.1287\:M \times\dfrac{1}{2}\times\dfrac{100}{1000} = 0.00643\:M}\]
The malic acid concentration can then be calculated as before, providing that the dilution resulting from addition of the KHP solution is included in the calculation.
\[\mathrm{[MA]_{juice} = [KHP]_{juice} \times \dfrac{Int_{MA}}{N_{MA}} \times \dfrac{N_{KHP}}{Int_{KHP}} \times \dfrac{1000}{900} = 0.00643\: M \times \dfrac{1.000}{2} \times \dfrac{4}{0.4351}\times \dfrac{1000}{900} = 0.0328\: M}\]
For purposes of comparison with the table provided in the background section of this laboratory, we can convert this concentration to g/L using the molecular weight of malic acid.
\[\mathrm{0.0.328\: M \times 134.09\: g/mol = 4.40\: g/L\: malic\: acid}\]
Spectrum of apple juice sample containing KHP