Chemistry LibreTexts

Problem 3

  • Page ID
    276159
  • \( \newcommand{\vecs}[1]{\overset { \scriptstyle \rightharpoonup} {\mathbf{#1}} } \) \( \newcommand{\vecd}[1]{\overset{-\!-\!\rightharpoonup}{\vphantom{a}\smash {#1}}} \)\(\newcommand{\id}{\mathrm{id}}\) \( \newcommand{\Span}{\mathrm{span}}\) \( \newcommand{\kernel}{\mathrm{null}\,}\) \( \newcommand{\range}{\mathrm{range}\,}\) \( \newcommand{\RealPart}{\mathrm{Re}}\) \( \newcommand{\ImaginaryPart}{\mathrm{Im}}\) \( \newcommand{\Argument}{\mathrm{Arg}}\) \( \newcommand{\norm}[1]{\| #1 \|}\) \( \newcommand{\inner}[2]{\langle #1, #2 \rangle}\) \( \newcommand{\Span}{\mathrm{span}}\) \(\newcommand{\id}{\mathrm{id}}\) \( \newcommand{\Span}{\mathrm{span}}\) \( \newcommand{\kernel}{\mathrm{null}\,}\) \( \newcommand{\range}{\mathrm{range}\,}\) \( \newcommand{\RealPart}{\mathrm{Re}}\) \( \newcommand{\ImaginaryPart}{\mathrm{Im}}\) \( \newcommand{\Argument}{\mathrm{Arg}}\) \( \newcommand{\norm}[1]{\| #1 \|}\) \( \newcommand{\inner}[2]{\langle #1, #2 \rangle}\) \( \newcommand{\Span}{\mathrm{span}}\)\(\newcommand{\AA}{\unicode[.8,0]{x212B}}\)

    The identical statistical results for Data Sets 1, 2 and 3 certainly suggests that all three data sets may be equally well explained by the same linear model. Let's look at this more closely. Open the Excel file containing the three data sets. Each data set is on a separate Excel worksheet.

    Task 1. For each data set, create a separate scatterplot with a linear trendline. How well does this linear model explain the relationship between X and Y for each data set? What does this imply about the usefulness of using R2 or R as the sole measure of a model's appropriateness?

    Task 2. For all three data sets, the value of R2 is relatively small. The linear model of data from the module's introduction

    CalCurve.png

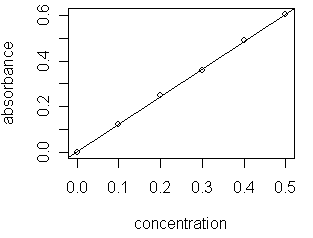
    on the other hand, has an R2 of 0.9997. Look carefully at Data Set 2. Is there a mathematical model that might better explain the relationship between X and Y? Remove the linear trendline and try a more appropriate model. You should be able to find a model with an R2 value of nearly 1.

    Look carefully at Data Set 3. It appears that the data are linear, so what is the reason for the relatively small value for R2? Edit the data to remove the problem and examine how this changes your model (if necessary, replot the data). You should be able to find a linear model with an R2 value of nearly 1.

    After completing these tasks, proceed to the module's summary.


    This page titled Problem 3 is shared under a CC BY-NC-SA 4.0 license and was authored, remixed, and/or curated by Contributor via source content that was edited to the style and standards of the LibreTexts platform; a detailed edit history is available upon request.

    • Was this article helpful?