
The t-Test
- Page ID
- 275894

The standard approach for determining if two samples come from different populations is to use a statistical method called a t-test. Although we will not worry about the exact mathematical details of the t-test, we do need to consider briefly how it works.
Recall that a population is characterized by a mean and a standard deviation. Suppose that for the population of pennies minted in 1979, the mean mass is 3.083 g and the standard deviation is 0.012 g. Together these values suggest that we will not be surprised to find that the mass of an individual penny from 1979 is 3.077 g, but we will be surprised if a 1979 penny weighs 3.326 g because the difference between the measured mass and the expected mass (0.243 g) is so much larger than the standard deviation. In fact, we can express this probability as a confidence interval; thus:
- 68.3% of 1979 pennies will have a mass of 3.083 g ± 0.012 g (±1 std dev)
- 95.4% of 1979 pennies will have a mass of 3.083 g ± 0.024 g (±2 std dev)
- 99.7% of 1979 pennies will have a mass of 3.083 g ± 0.036 g (±3 std dev)
The probability of finding a 1979 penny whose mass is outside the range of 3.047 g - 3.119 g, therefore, is 0.3%. These probabilities hold for a single sample drawn from any normally distributed population. Thus, there is a 99.7% probability that a measurement on any single sample will be within ±3 standard deviation of the population's mean.
We also can extend the idea of a confidence interval to larger sample sizes, although the width of the confidence interval depends on the desired probability and the sample's size. As we did above, let's assume that the population of 1979 pennies has a mean mass of 3.083 g and a standard deviation of 0.012 g. This time, instead of stating the confidence interval for the mass of a single penny, we report the confidence interval for the mean mass of 4 pennies; these are:
- 68.3% of 1979 pennies will have a mass of 3.083 g ± 0.006 g (±1 std dev)
- 95.4% of 1979 pennies will have a mass of 3.083 g ± 0.012 g (±2 std dev)
- 99.7% of 1979 pennies will have a mass of 3.083 g ± 0.018 g (±3 std dev)
Note that each confidence interval is half of that for the mass of a single penny.
Now we are ready to consider how a t-test works. Suppose that we want to determine if two samples are different and that we want to be at least 95% confident in reaching this decision. We analyze each sample and determine their respective means and standard deviations. For each sample we can represent the confidence interval using a solid circle to represent the sample's mean and a line to represent the width of the sample's 95% confidence interval. If the 95% confidence intervals for the two samples do not overlap, as shown in case 1 below, then we can state that we are least 95% confident that the two samples come from different populations. Note that there is no more than a 5% probability that this conclusion is incorrect.
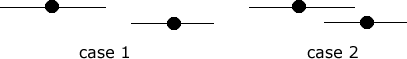
On the other hand, if the 95% confidence intervals overlap, then we cannot be 95% confident that the samples come from different populations and we conclude that we have insufficient evidence to determine if the samples are different. Note that we are not 95% confident that the samples are the same; this is a subtle, but important point.
When you are ready, proceed to Problem 1.