
Qualitative and Quantitative Analysis via GC-MS
- Page ID
- 287905

Demo on MS Instrumentation
This document provides a script for introducing students to GC/MS instrumentation. It can serve as an outline, provides details on instrument operation, and includes questions, answers, and discussion points. It should be handed out to students after the actual demo.
- Carrier gas
What is the typical carrier gas used in most GC separations?
Can any grade (purity) carrier gas be used?
Why or why not?
- Box diagram of an MS system
What are the five basic components common to all MS systems?
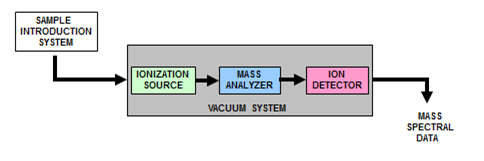
- Sample introduction system
What is the (rather obvious) sample introduction system to the MS?
Are any other sample introduction systems required?
- Ionization source
What is the most common ionization mode used in GC/MS?
Can you name any other gas phase ionization modes?
Show students a filament assembly and where/how CI reagent gas is introduced into the system.
- Mass analyzer
What is type of mass analyzer is used in this GC/MS system?
Show students an ion trap assembly and describe how it works.
- Detector
What is the most common type of detector used in MS systems?
Show students an electron multiplier and describe how it works.
- Vacuum system
So what is the fifth and last component of an MS system that we’ve yet to describe?
What pump(s) are used to generate a vacuum?
Show students an old turbo pump and describe how it works.
Describe why two pumps are needed to “bridge the gap” between MS operating pressures of ~10-4 torr and ambient pressure (< 103 torr).
Pre-class assignment on understanding mass spectra
Learning Objectives
The learning objectives associated with this assignment are to
- Predict the mass spectrum of known compounds
- Interpret the mass spectra of known compounds
Consider fluorobenzene.
- What is the molecular formula?
- What is the average molecular weight?
- What is the nominal (integer) molecular weight (M) of fluorobenzene in which the C, H, and F atoms are all in the form of the most common isotopes?
- Predict all possible elemental compositions and corresponding masses of your compound. Hint – look up a table of isotopic abundances of the elements and take into account all of the naturally occurring isotopes of the different elements in your compound.
- What is the most likely elemental composition of the M+1 ion?
- Look up the EI mass spectrum of your assigned compound (http://webbook.nist.gov/chemistry/)
- What is m/z value of the base peak in the mass spectrum?
- Write a balanced reaction showing the formation of this species.
- Why is the molecular ion the base peak? Hint – consider its stability.
- What is m/z value of the base peak in the mass spectrum?
In class, we’ll review student answers to these questions (and show that the average mw is irrelevant to the mass spectrum).
In-class assignment on understanding mass spectra
Learning Objectives
The learning objectives associated with this assignment are to
- Predict the mass spectrum of known compounds
- Interpret the mass spectra of known compounds
Students will be assigned into four groups, each focusing on a different trihalomethane species.
- Group 1 – trichloromethane (aka chloroform)
- Group 2 – dichlorobromomethane
- Group 3 – chlorodibromomethane
- Group 4 – tribromomethane (aka bromoform)
- Predict all possible elemental compositions and corresponding masses of your compound. Hint – look up a table of isotopic abundances of the elements and take into account all of the naturally occurring isotopes of the different elements in your compound.
- What is the most likely elemental composition of the M+1 ion (where M corresponds to the molecular ion)?
- What is the most likely elemental composition of the M+2 ion?
- What is the most likely elemental composition of the M+4 ion?
- Look up the EI mass spectrum of your assigned compound (http://webbook.nist.gov/chemistry/).
- What is m/z value of the base peak in the mass spectrum?
- What is the elemental composition of the ion corresponding to the base peak
- Write a balanced reaction showing the formation of this species.
- Why is this ion the base peak? Hint – consider its stability.
- What is m/z value of the base peak in the mass spectrum?
- What is the elution order of these four compounds? Hint – consider their boiling points.
Hands-On Session on Qualitative Analysis
Learning Objectives
The learning objectives associated with this assignment are to:
- Interpret the mass spectra of unknown compounds
- Recognize the utility and limitations of library searching for compound identification
- Describe the process for how a compound can be definitively identified via GC/MS
This assignment requires access to the NIST mass spectral library, a GC/MS data system, and GC/MS data files on samples ranging from simple to complex mixtures (i.e., pesticide mixture, column test mixture, etc.). Refer to the SOP on GC/MS data analysis for details on how to use the data system.
- This problem will involve interpretation of GC/MS data on a known mixture containing several pesticides. The goal is to identify the peaks corresponding to naphthalene, DDT, and p-dichlorobenzene.
The instructor will perform this data analysis and in doing so will demonstrate how to open a data file, how to view the chromatogram and mass spectra corresponding to different peaks, how to perform library searching, and how to interpret the results.
Library searching should give good results for naphthalene (the correct identity is the #1 compound on the “hit list”), and more ambiguous results for DDT and p-dichlorobenzene (library search may give isomers or closely related compound ranked higher on the hit list).
- This problem will involve interpretation of GC/MS data on a column test mixture containing a variety of compound classes. Students can work in small groups to answer these questions. Fill out the table below and identify the following compounds in this mixture.
Compound Retention time (min) Rank on hit list Match factor - nonanal
- methyl decanoate
- methyl decanoate
- decane
- undecane
- This problem will involve identification of low ppb levels of hexachlorobenzene (HCB) in this same column test mixture. Since this chromatogram has many peaks and the HCB peak is small, you should not attempt to go through the chromatogram and evaluate each peak to determine whether it is HCB or not. Instead, you will use a faster means to identify HCB by following the steps below.
- Look up the EI mass spectrum of HCB (http://webbook.nist.gov/chemistry/ or better yet use the NIST software on the data system).
- Identify the m/z values of the three most intense ions of HCB.
- Use the data system to show selected ion chromatograms for these three ions.
- Determine the retention time for the peak corresponding to HCB, as well as the rank on the hit list and the match factor.
- Is this data definitive proof that this sample contains HCB and do you think that you have enough evidence to definitively establish its identity?
- What additional information is needed to confirm that this peak indeed corresponds to HCB?
Need another example to show that a retention time match is required to differentiate between xylenes and ethylbenzene or CHCl3 and CHCl2Br
Demo and Hands-On Session on Quantitative Analysis
Learning Objectives
The learning objectives associated with this assignment are to:
- Differentiate the implementation and performance metrics of external and internal standard based calibration methods
- Employ external and internal standard based calibration methods for quantitative analysis of a target compound
- What is plotted on the y axis to show GC/MS response during an analysis?
- What should we plot on the y axis of a calibration curve to quantify GC/MS response?
- For this question, you will generate external and internal standard based calibration curves from analysis of a set of standards containing naphthalene (the analyte of interest) and D8-naphthalene (the internal standard). Use the GC/MS data files 10_ng, 20_ng, 40_ng, 50_ng, 80_ng, 120_ng, 160_ng, and 200_ng which are stored in the C:\VarianWS\MSTutorials directory.
- Open the data file of interest
- Display a selected ion chromatogram for the naphthalene quan ion (i.e. the answer to question 1) and compute and record the area of the peak corresponding to naphthalene.
- Repeat step b for the internal standard (D8-naphthalene).
- Repeat steps a through c for a total of 8 different data files (i.e., 10, 20, … 200 ng).
- Provide a table showing the peak areas as a function of mass (i.e., 10, 20, … 200 ng).
- Provide an external standard-based cal curve. Be sure to label the axes properly (include units), include a regression line, and indicate the regression statistics (show regression equation and R2 value).
- Provide an internal standard-based cal curve. Be sure to label the axes properly (include units), include a regression line, and indicate the regression statistics (show regression equation and R2 value).
Contributors and Attributions
- Peter Palmer, San Francisco State University (palmer@sfsu.edu)
- Sourced from the Analytical Sciences Digital Library