
Fourier Transformation of Data
- Page ID
- 291565

\( \newcommand{\vecs}[1]{\overset { \scriptstyle \rightharpoonup} {\mathbf{#1}} } \) \( \newcommand{\vecd}[1]{\overset{-\!-\!\rightharpoonup}{\vphantom{a}\smash {#1}}} \)\(\newcommand{\id}{\mathrm{id}}\) \( \newcommand{\Span}{\mathrm{span}}\) \( \newcommand{\kernel}{\mathrm{null}\,}\) \( \newcommand{\range}{\mathrm{range}\,}\) \( \newcommand{\RealPart}{\mathrm{Re}}\) \( \newcommand{\ImaginaryPart}{\mathrm{Im}}\) \( \newcommand{\Argument}{\mathrm{Arg}}\) \( \newcommand{\norm}[1]{\| #1 \|}\) \( \newcommand{\inner}[2]{\langle #1, #2 \rangle}\) \( \newcommand{\Span}{\mathrm{span}}\) \(\newcommand{\id}{\mathrm{id}}\) \( \newcommand{\Span}{\mathrm{span}}\) \( \newcommand{\kernel}{\mathrm{null}\,}\) \( \newcommand{\range}{\mathrm{range}\,}\) \( \newcommand{\RealPart}{\mathrm{Re}}\) \( \newcommand{\ImaginaryPart}{\mathrm{Im}}\) \( \newcommand{\Argument}{\mathrm{Arg}}\) \( \newcommand{\norm}[1]{\| #1 \|}\) \( \newcommand{\inner}[2]{\langle #1, #2 \rangle}\) \( \newcommand{\Span}{\mathrm{span}}\)\(\newcommand{\AA}{\unicode[.8,0]{x212B}}\)
Exercise 1 – Sampling Rate (SR), Acquisition Time (AQ), and Number of Data Points (NDP)
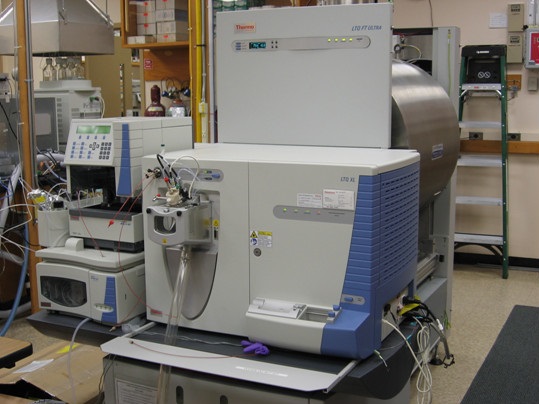
A type of instrument called a Fourier Transform Ion Cyclotron Resonance Mass Spectrometer (FT-ICR-MS) costs about the same as a nice NMR ($500k) and is used in a variety of applications where ultra-high resolution mass information is required. The FT-ICR-MS at the Woods Hole Oceanographic Institution (pictured below) uses a sampling rate of 500 kHz and FT to produce a mass spectrum from a digitized complex waveform containing 65,536 data points in the time domain. The complex waveform contains information about ion cycling frequencies, which are in turn connected directly to ion m/z ratios.
- When we say the FT-ICR-MS has a sampling rate of 500 kHz, describe what is being sampled?
- What is the νmax that corresponds to the sampling rate for this instrument?
- Calculate the acquisition time for a raw FT-ICR-MS data file.
- Calculate the digital resolution (Δν) for the FT-ICR-MS.
- How would you change the settings to increase the digital resolution of the FT-ICR-MS? You may reasonably assume that the size of data files is determined by the hardware/software and thus can’t be changed.
- Is there any danger to the change you proposed above?
Exercise 2 – Frequency Ranges and Noise
- Does sampling rate influence the range of frequencies that you can detect using FT-NMR? Explain briefly.
- What would be the problem if a background signal due to noise (that was necessarily a component of the raw FID) had a characteristic frequency that exceeded νmax?
- How would you solve this problem if you were the person responsible for instrument design?
Contributors and Attributions
- David Griffith, Willamette University (dgriffit@willamette.edu)
- Sourced from the Analytical Sciences Digital Library