
Uncertainty
- Page ID
- 279198

Reading
For the first half of this lesson:
Chapter 2 (sections 1, 3 (first part), 4, 5, 6, 9), Chapter 3 (sections 1, 2, 3, 4), Exploring Chemical Analysis 5th ed., D. Harris
Suppose you are analyzing soil samples from a school playground near a busy intersection. After collecting three samples, you return to the lab, extract the soil samples with water and, using an atomic absorption spectrometer (we will talk more about instrumentation later), determine the concentration of lead in the resulting extracts, obtaining an average result of 4.38 parts-per-billion (ppb).
- The actual value that you report is 4.38 ± 0.02 ppb. What does the 0.02 ppb indicate?
STOP
- Brainstorm what errors might affect this result?
- Separate the errors discussed in class into systematic vs. random
|
Systematic (Determinate) |
Random (Indeterminate) |
|---|---|
|
|
|
STOP
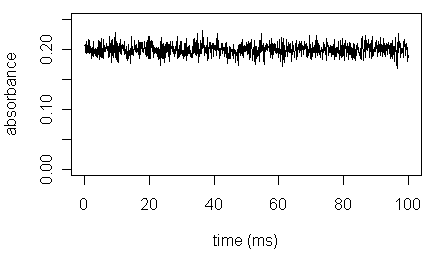
Instrument noise
- Often when discussing precision and accuracy we use a model of darts on a dartboard as shown below.
- As a group come to a conclusion of what accuracy and precision are based on previous knowledge and write your definition below.
- Accuracy:
-
Precision:
- Accuracy:
- As a group come to a conclusion of what accuracy and precision are based on previous knowledge and write your definition below.
- Label the top and side of the table with accurate, not accurate, precise, and not precise.
- Circle the dartboard depictions show random error and put a square around the dartboard depictions that show systematic error.
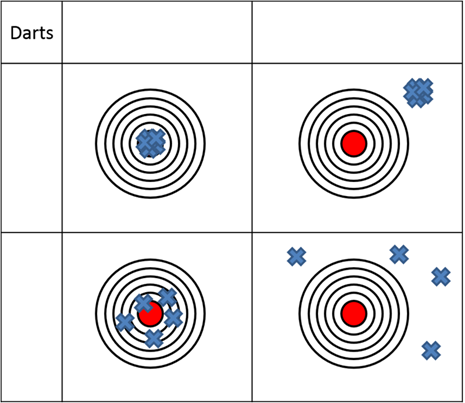
Figure 1. Dart model of precision and accuracy.
STOP
Measurement Exercise

- Experiment 1: Using a ruler with a millimeter scale, measure the big solid rectangle's width and length in millimeters on your own without any consultation of your group then collect the values of your group mates in the table and calculate the average values.
|
Group Members |
Length (mm) |
Width (mm) |
|---|---|---|
|
|
|
|
|
|
|
|
|
|
|
|
|
|
|
|
|
Average |
|
|
- Are your measurements of the rectangle's length and width exactly the same as those of your classmates, or are they different? If there are differences in the measurements, is this the result of determinate errors, indeterminate errors or both? What are those errors? Briefly explain your reasoning.
STOP
When measuring the rectangle's length and width you had to make several decisions:
- How do you define the rectangle? Should you measure its length and width from the outside edges of the border, from the inside edges or from the middle of the border?
- Experiment 2: Decide as a group how you are going to define the rectangle and record your measurement to the tenth place (which is an estimation of one digit past the smallest gradation). Then measure the length and width of the rectangle and calculate its average.
|
Group Members |
Length (mm) |
Width (mm) |
|---|---|---|
|
|
|
|
|
|
|
|
|
|
|
|
|
|
|
|
|
Average |
|
|
STOP
Significant Figures
You may recall from general chemistry that we refer to the digits in our measurements as significant figures. A significant figure is any number in which we can express confidence, including those digits known exactly and the one digit whose value is an estimate. The lengths 154 mm and 154.3 mm have three and four significant digits, respectively. The number of significant figures in a measurement is important because it affects the number of significant figures in a result based on that measurement.
- How many significant figures do you have in each of your individual measurements of length and width?
|
Group Members |
# sig figs in length |
# sig figs in width |
|---|---|---|
|
|
|
|
|
|
|
|
|
|
|
|
|
|
|
|
Before continuing, let's review the rules for including significant figures in calculations. When adding or subtracting, the result of the calculation is rounded to the last decimal place that is significant for all measurements. For example, the sum of 135.621, 0.33 and 21.2163 is 157.17 since the last decimal place that is significant for all three numbers (as shown below by the vertical line)
\[
\begin{array}{r|l}
135.62\hspace{-4pt} & \hspace{-4pt}1 \\[-2pt]
0.33\hspace{-4pt} & \\[-2pt]
21.21\hspace{-4pt} & \hspace{-4pt}63 \\
\hline
157.16\hspace{-4pt} & \hspace{-4pt}73 \\
\end{array}
\nonumber\]
is the hundredth's place. Note that rounding the answer to the correct number of significant figures occurs after completing the exact calculation.
When multiplying or dividing, the result of the calculation contains the same number of significant figures as that measurement having the smallest number of significant figures. Thus,
\[\dfrac{22.91\times0.152}{16.302}=0.21361\approx 0.214\nonumber\]
because 0.152, with three, has the fewest number of significant figures.
One way to think about this is that we cannot make a measurement more precise through a calculation than it is when we take the measurement.
- Check back to be sure that your group has the correct number of significant figures in the average length and width listed for Experiment 2, if not fix them.
STOP
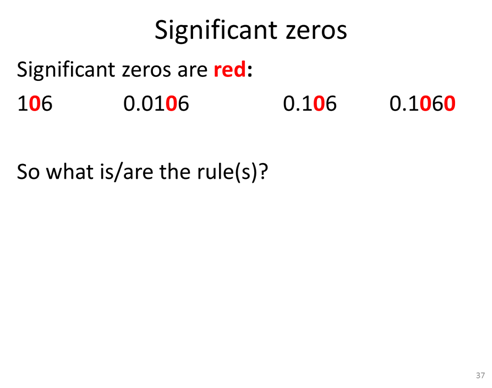
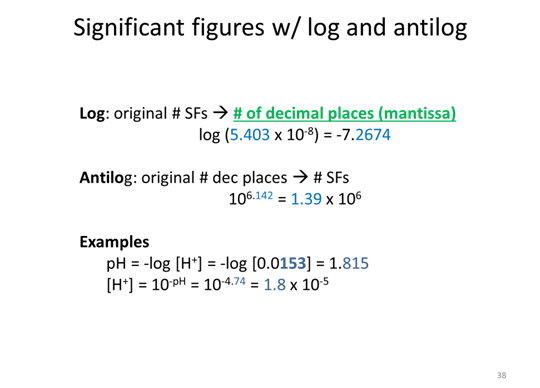
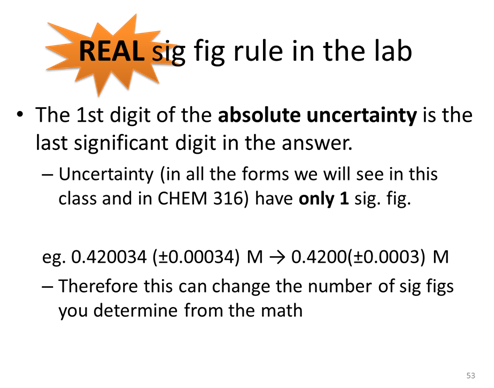
Three additional SF rules
Uncertainty in the lab
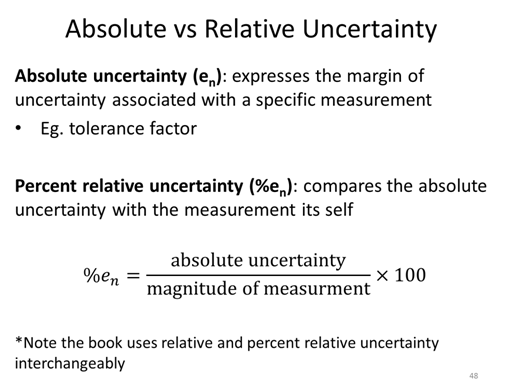
- If you took a measurement and found a value of 89.231 ± 0.008 what is the absolute uncertainty and the percent relative uncertainty of the measurement?
STOP
Propagation of Uncertainty
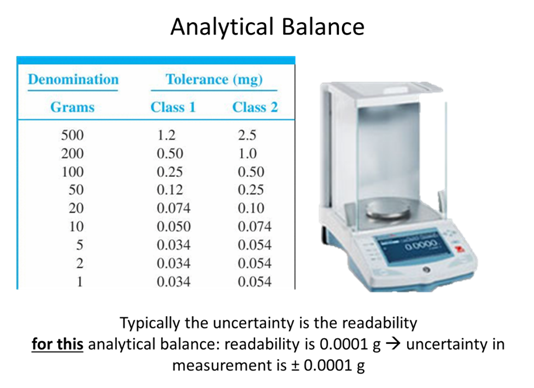
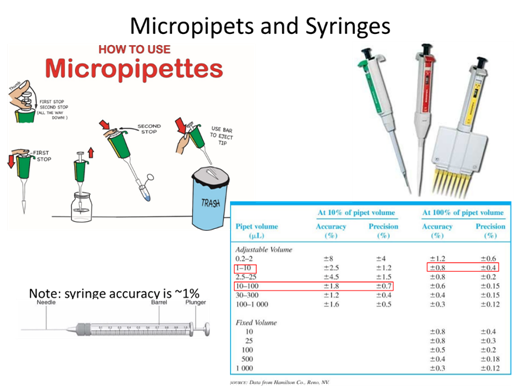
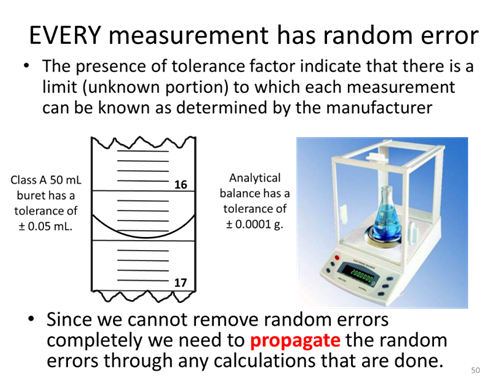
As we have discussed, each instrument we use in a lab has an associated random error, which is often expressed as a tolerance factor by the manufacturer. A more rigorous approach to determining the uncertainty in a result is called a propagation of uncertainty and it combines the uncertainty in each measurement to estimate the uncertainty in the final result.
The following equations for propagation of uncertainty are from your textbook (as noted in parentheses):
Addition and Subtraction:
\[e_{prop}=\sqrt{e_1^2 + e_2^2+e_3^2+⋯e_n^2} \tag{3-5}\]
Multiplication and Division:
\[\%e_{prop}=\sqrt{(\%e_1^2)+(\% e_2^2)+(\%e_3^2)+⋯(\%e_n^2)} \tag{3-6}\]
Where en is the absolute uncertainty (often the tolerance factor) for measurement n and %en is the percent relative uncertainty for measurement n.
The REAL SIG FIG RULE
The final uncertainty to one significant figure and that defines how many significant figures are in the measurement. For example if you took several measurements and the average value was 234.7182 a.u., but the uncertainty when propagated was 0.0278 a.u. you would write the final result as 234.72 ± 0.03 a.u.
- Assuming that the error associated with the ruler is 0.1 mm, propagate the error associated with the average of the length and the width of the rectangle using the data from Experiment 2.
- What is the absolute uncertainty of each measurement?
- Should you use the addition/subtraction or multiplication/division equation above to propagate the error?
- Calculate the error and write it with the proper number of sig. figs is the table below.
- What is the absolute uncertainty of each measurement?
|
|
Average length (mm) |
Average width (mm) |
|---|---|---|
|
Error |
|
|
- Asking yourself the same questions as above, calculate the average area of the rectangle including the propagated error and the correct number of sig figs and write the value in the table.
Average area w/ error (mm2)
STOP
- As a group think of times in the lab you may want to use the addition and subtraction rule to propagate uncertainty and one time in lab you would want to use multiplication and division rule to propagate uncertainty.
STOP
Often propagation of error includes mixed operation. Like finding the area of the rectangle, except I walked you through how to do that. Now you are going to propagate error for a scientific system you have never seen before.
- For a concentration technique the relationship between the signal and the an analyte’s concentration is
\[S_\textrm{total} = k_\textrm{A}C_\textrm{A} + S_\textrm{mb}\nonumber\]
What is the analyte’s concentration, CA, and its uncertainty if Stotal is 24.37 ± 0.02, Smb is 0.96 ± 0.02, and kA is 0.186 ± 0.003 ppm–1.
STOP
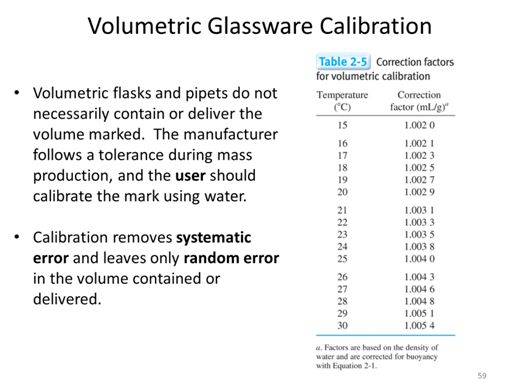
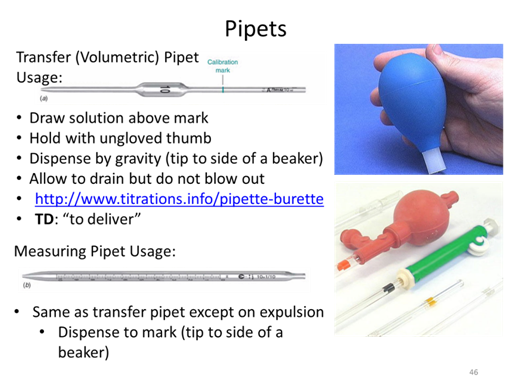
- Given the following masses of deionized water measured during the calibration of a Class A pipet at 15 °C, what average volume of water is the 10.00 mL Class A (± 0.02 mL) pipet actually delivering?
|
Measurement |
Mass of H2O (g) |
|---|---|
|
1 |
10.1578 |
|
2 |
10.1341 |
|
3 |
10.1425 |
|
4 |
10.1453 |
|
5 |
10.1672 |
|
6 |
10.1587 |
|
7 |
10.1611 |
STOP
- Explain, with numerical values, glassware, and instruments how you would prepare 50 mL of a 1.40 M aqueous stock solution of sodium thiosulfate, Na2S2O3 (MW= 158.11 g/mol) (which is a solid that must be dissolved) while introducing the least amount of error. (similar example pg 23 of textbook)
STOP
- Explain, with numerical values, glassware, and instruments how you would prepare a 100 mL of a 0.140 M aqueous solution of sodium thiosulfate from the 1.40 M stock solution in the previous problem while introducing the least amount of error.
STOP
Homework for data analysis
- How is systematic error identified and accounted for in measurements?
- How is random error identified and accounted for in measurements?
- In a lab at 27°C you weigh an empty volumetric flask at 468.654 g you then fill the flask up to the calibration mark with DI H2O and weigh the flask at 543.635 g. What is the true volume contained in the volumetric?
- What is the true concentration of dissolved 0.1567 g of Na2S2O3 in molarity if you made it in the volumetric flask in the previous example?
- What portion of the analytical process do the tools we talked about today fall under?
- If you made a 5 M solution via dilution of a 10 M solution using volumetric glassware and you performed several forms of analytical analysis and determined that the true concentration of the solution was 4.5 M what should be done to avoid this problem in the future?