
Standard Addition Method
- Page ID
- 280722

This method is highly recommended to evaluate/compensate for matrix interferences in the analysis and for complex matrix samples.
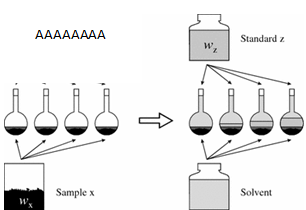
To use it:
- Solutions of known concentration are prepared (standards z).
- To each of those standards a known and similar amount of the sample (x) is added before completing volume with the solvent.
- Instrumental signal of the standard solutions are recorded.
- Sample concentration by extrapolation of the linear equation to y = 0.
- Either one standard or several standards, to create a calibration curve, may be used.
A single point standard addition is done by preparing one standard with the sample, and recording the signal of this standard with the sample and the diluted sample by itself. For multiple standard addition calibration, several standards are prepared and a lineal equation is used to calculate the concentration of the sample.
One point standard addition –Single standard
- A third spectrophotometric method to determine Pb2+ in blood gave a signal of 0.193 when 1.00 ml of the samples was diluted up to 5 ml. To a second blood sample, 1.00 ml, 1.00 µl of the standard solution of 1560 ppb Pb2+ and then diluted up to 5 ml. This new sample gave a signal of 0.419.
- How much blood did you use?
- What was done to the first sample?
- What different was done to the second sample?
- What is concentration of Pb2+ in the blood sample?
- How much blood did you use?
ADDITIONAL EXERCISE…
- Ascorbic acid (vitamin C) was determined by an electrochemical method in 50.0 ml orange juice sample. A current of 1.78 µA was obtained. When a similar solution was mixed with 0.400 ml of the 0.279 M ascorbic acid, current increased to 3.35 µA. What is the concentration of the ascorbic acid in the sample?

Standard Addition with Multiple solutions.
The figure below shows several standard solutions used for standard addition. Solvent was water and each of them contain 25 ml of the sample.
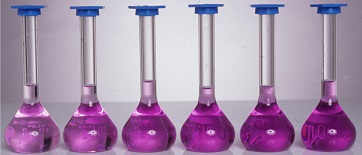
- The first solution on the left has no standard. Why does it have color?
- From left to right, each solution contains 0.00, 1.00, 2.00, 3.00, 4.00 and 5.00 ml of a 100.6 mg/l of analyte solution. Does that explain why the solution in the far right is darker? Why?
Signal of each solution was recorded and plotted vs the concentration of each solution. When observing the plot, why does the line not cut the y-axis in 0 mg/l?

- To calculate the concentration of the sample, x intercept is calculated by replacing y = 0 in the line equation (y = mx + b) and solving for x.
Sometimes, the plot may be done using volume of standard added, instead of its concentration. In those cases, remember to convert the volume of the analyte in the sample to concentration.
- Another spectrophotometric method to determine Pb2+ in blood requires a standard addition calibration curve. Standards were prepared by adding 1.00 ml of blood to each one, and an external standard of 1560 ppb of Pb2+ was added. All the samples were diluted to 5.00 ml before measuring the signal. A calibration curve of signal vs volume of standard added produced an equation of:
\[Signal = 0.266+312\: mL^{-1}\times V_{std} \nonumber\]
-
What is concentration of Pb2+ in the blood sample?
- Could we use the same calibration curve for other blood samples? Why?
- Could we use the same calibration curve to determine lead in seawater?
- What advantages does this calibration method have when compared to a direct calibration?
- What disadvantages does this calibration method have when compared calibration?
- Would you recommend this method to analyze any kind of blood sample: adult, baby, fly blood? Consider sample size.
-