
Acid-Base Titrations: Simulations
- Page ID
- 282804

Titration of a Weak Acid
\[\ce{HA ⇌ H+ + A-}\nonumber\]
What is true about [HA] and [A-] when the pH is equal to pKa?
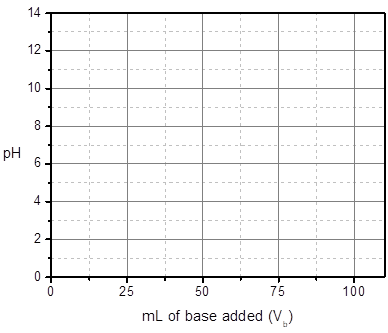
Sketch the curve that results when 50 mL of 0.1 M valproic acid (Depakote, Ka = 1.6 × 10⁻⁵) is titrated with 0.1 M NaOH.
\[\ce{HA + OH- ⇌ H2O + A-}\nonumber\]
Ask yourself:
- What happens to pH as base is added?
- Can you approximate pKa?
- How many mL of base will convert “all” the HA to A-? Is A- acidic, basic or neutral?
- How many mL of base will result in [HA] = [A-]?
- After adding a large amount of base, pH ≈ pH of the titrant. Can you estimate the pH of the titrant?
What if we generated the same data for penicillin G (Ka = 1.6 × 10⁻³)?
What about Glipizide (Ka = 1.3 × 10⁻⁶)?
What if we diluted the valproic acid (Ka = 1.6 × 10⁻⁵) and the NaOH from 0.1 M to 0.01 M?
Ask yourself:
- Does this change the pH at ½Veq?
- Does this change the pH when Vb is very large?
pH at Veq will be about halfway between pH at ½Veq and the final pH.
|
Section of Curve |
Dominant Species |
Calculation Strategy |
|---|---|---|
|
Start (Vb = 0) |
|
|
|
Pre-equivalence point |
|
|
|
At equivalence point |
|
|
|
Post-equivalence point |
|
|
Remember that the volume of the solution is changing as titration proceeds!
Calculate the pH at the following points on a titration curve of 50 mL of 0.1 M valproic acid (Ka = 1.6 × 10⁻⁵) titrated with 0.1 M NaOH.
- After the addition of 0 mL of base (do for independent practice, see previous notes).
- After the addition of 10 mL of base.
- After the addition of 50 mL of base (do for independent practice, see previous notes).
- After the addition of 75 mL of base.
Practice Exercises: Titration of Weak Acids
- Visit the titration simulator at https://dthdpu.shinyapps.io/TitrationApp/ and spend some time playing with the parameters in Investigation 2: Titration of a Monoprotic Weak Acid or Weak Base. Based on your observations, answer the questions that follow.*
- How does the pKa of the weak acid affect the shape of the titration curve? Be specific.
- How does the concentration of the weak acid affect the shape of the titration curve? (Note that the default setting makes the concentration of the titrant equal to the concentration of the weak acid.)
- How does the volume of the weak acid solution affect the shape of the titration curve? Be specific.
- Change the analyte from a weak acid to a weak base. How does the titration curve change?
- Sketch estimated titration curves for 0.1 M HCl and 0.1 M aspirin (Ka = 3.2 × 10⁻⁴) titrated with equimolar NaOH on the same axes. Consider the location of landmark points and effect of reaction completeness on the shape of the curves.
Titration of a Weak Base
\[\ce{B + H2O ⇌ BH+ + OH-}\nonumber\]
If Kb of B is 1.0 × 10⁻⁶, what is the pKa of BH+?
What is true about [B] and [BH+] when the pH is equal to pKa of BH+?
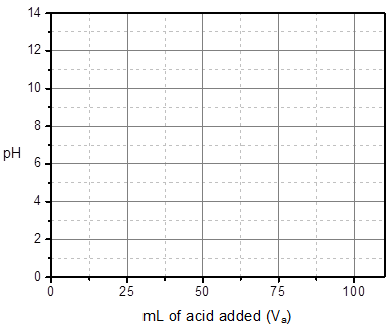
Sketch the curve that results when 50 mL of 0.1 M free base cocaine (Ka of BH+ = 2.5 × 10⁻⁹) is titrated with 0.1 M HCl.
\[\ce{B + H+ ⇌ BH+}\nonumber\]
Ask yourself:
- What happens to pH as acid is added?
- Can you approximate pKa?
- How many mL of acid will convert “all” the B to BH+? Is BH+ acidic, basic or neutral?
- How many mL of acid will result in [B] = [BH+]?
- After adding a large amount of base, pH ≈ pH of the titrant. Can you estimate the pH of the titrant?
What if we generated the same data for ketamine (Ka of BH+ = 3.2 × 10⁻⁸)?
What about methamphetamine (Ka of BH+ = 1.3 × 10⁻¹⁰)?
What if we diluted the cocaine (Ka of BH+ = 2.5 × 10⁻⁹) and the HCl from 0.1 M to 0.01 M?
Ask yourself:
- Does this change the pH at ½Veq?
- Does this change the pH when Va is very large?
pH at Veq will be about halfway between pH at ½Veq and the final pH.
|
Section of Curve |
Dominant Species |
Calculation Strategy |
|---|---|---|
|
Start (Va = 0) |
|
|
|
Pre-equivalence point |
|
|
|
At equivalence point |
|
|
|
Post-equivalence point |
|
|
Remember that the volume of the solution is changing as titration proceeds!
Titration of Diprotic Species
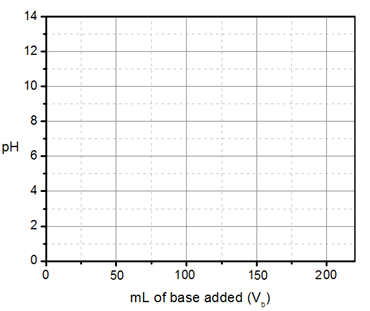
Sketch the curve that results when 50 mL of 0.1 M fumaric acid is titrated with 0.1 M NaOH.
\[\ce{H2A + OH- ⇌ H2O + HA-} \hspace{20px} (K_\textrm{a,1} = 9.3×10^{-4})\nonumber\]
\[\ce{HA- + OH- ⇌ H2O + A^2-} \hspace{20px} (K_\textrm{a,2} = 3.6×10^{-5})\nonumber\]
Ask yourself:
Ask yourself:
- How many mL of NaOH must be added to convert all the H2A into HA- (Veq,1)? Can you estimate the pH of the resulting HA- solution?
- What will be the pH at ½ Veq,1?
- How many mL of NaOH must be added to convert all the HA- into A2- (Veq,2)? Will this solution be acidic, basic or neutral?
- What will be the pH halfway between Veq,1 and Veq,2?
To help keep track of the landmark points and shape of the curve, use the table below:
|
Vb (mL) |
pH |
Shape of Curve (shallow or steep) |
|---|---|---|
|
25 |
|
|
|
50 |
|
|
|
75 |
|
|
|
100 |
|
|
|
>150 |
|
|
This is the titration of a diprotic acid.
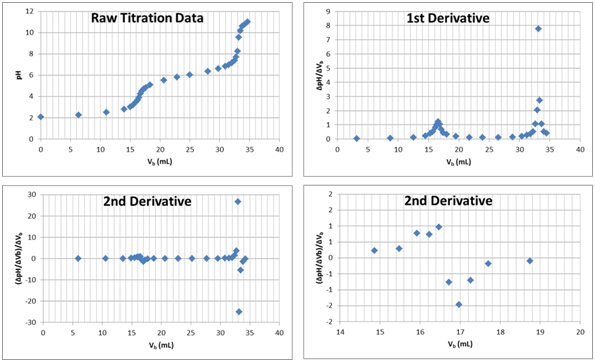
How can we tell it is an acid being titrated?
How can we tell it is diprotic?
Estimate pKa1 and pKa2 for this diprotic acid.
How many mL are required to reach the first equivalence point (H2A → HA-)?
How many mL are required to reach the second equivalence point (HA- → A2-)?
Circle the section(s) of the raw titration data where a buffer is present.
Practice Exercises: Titrations of Weak Bases and Diprotic Species
- Calculate the pH at the following points on a titration curve of 50 mL of 0.1 M free base cocaine (Ka of BH+ = 2.5 × 10⁻⁹) titrated with 0.1 M HCl.
- After the addition of 0 mL of acid.
- After the addition of 35 mL of acid.
- After the addition of 50 mL of acid.
- After the addition of 80 mL of acid.
- Visit the titration simulator at https://dthdpu.shinyapps.io/TitrationApp/ and spend some time playing with the parameters in Investigation 3: Titration of a Diprotic Weak Acid or Weak Base. Based on your observations, answer the questions that follow.*
- What determines the y-values (pH values) of the three plateaus in the titration curve?
- What determines the x-values (volumes) of the two steep portions of the curve?
- How far apart must the two pKa values be in order to observe two distinct inflection points? Give some specific examples to support your conclusion.
Contributors and Attributions
- Michelle Kovarik, Trinity College (michelle.kovarik@trincoll.edu)
- Sourced from the Analytical Sciences Digital Library
- *The titration simulator was designed by Prof. David Harvey.