
Electron Shielding
- Page ID
- 79327

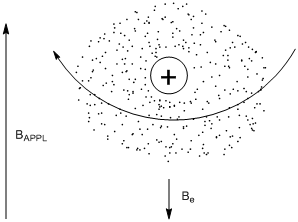
While it might be tempting to think that spinning electrons generate a magnetic field that in some way is responsible for shielding, this is not the case. If we think about organic compounds, they have an even number of electrons that are paired up in molecular orbitals. The spins of two paired electrons in a molecular orbital generate opposing magnetic fields that cancel each other out. What actually happens is that the electrons in a molecule (often represented as an electron “cloud”) circulate about BAPPL as shown in Figure \(\PageIndex{1}\). A circulating charged “cloud” of electrons does create a magnetic field. This magnetic field usually opposes BAPPL, hence the use of the term “shielding” to describe this effect. Figure \(\PageIndex{1}\) also shows a vector representation for Be (note, the size of the vectors for Be and BAPPL in Figure 9 are not accurately represented as Be is very much smaller than BAPPL).
Does electron density affect the magnitude of Be? If so, what is the relationship?
Solution
Intuition likely suggests that the greater the electron density about a hydrogen nucleus, the larger the magnitude of Be. This is correct. Electron withdrawing groups such as oxygen-containing moieties and halogens reduce the electron density about nearby hydrogen atoms. These reduce the shielding and the magnitude of Be.
Does a more highly shielded nucleus absorb higher frequency (higher energy) or lower frequency (lower energy) radiation?
Solution
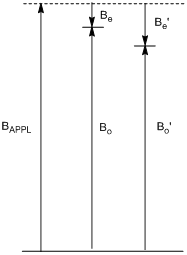
Figure \(\PageIndex{2}\) shows vector representations for BAPPL, Be, and Bo for two different hydrogen nuclei, one of which is more shielded than the other. Note that the larger the electronic shielding, the lower the value of Bo, the lower the energy between the ground and excited state, and the lower the frequency of absorption.
NMR spectra are represented with the magnitude of absorbance on the y-axis and frequency on the x-axis. However, as will be seen later in this unit, it is inconvenient to report these frequencies in MHz. A better way to report the frequencies is to convert them to a parts-per-million scale, which is denoted as a \(\delta\) value. In NMR spectroscopy, it is also necessary to adopt a uniform zero reference. Remember that the frequency of radiation absorbed by a particular hydrogen nucleus in a molecule is dependent on BAPPL. 400 MHz spectrometers have a BAPPL of 9.4 Tesla. However, variations in the manufacturing of each magnet mean that two different 400 MHz NMR spectrometers likely have slight differences in the magnitude of BAPPL (e.g., one might have a field of 9.400 Tesla while a second has a field of 9.401 Tesla). Even such a small change in the size of BAPPL will alter the magnitude of the frequency needed to excite a particular 1H nucleus in a molecule; hence the need for a zero reference.
The common zero reference for samples run in organic solvents is tetramethylsilane [Si(CH3)4] (TMS). The methyl groups in TMS are all equivalent and appear as one singlet in the spectrum. They are also highly shielded because there are no electron withdrawing groups in the compound and because of the 3p electrons from the silicon. The position of resonances in the \(\delta\) or ppm scale are normalized to the zero reference as shown in Equation \ref{8}.
\[\Delta (ppm)= \dfrac{v_{samp} - v_{ref}}{v_{ref}} \times 10^6 \label{8}\]
Suppose the resonant frequency of the TMS singlet on a 400 MHZ NMR spectrometer is exactly 400 MHz. What is the chemical shift in ppm for a signal that has a resonant frequency of 400,000,400 Hz?
Solution
The calculation of the chemical shift is shown in Equation \ref{9}.
\[ \begin{align} \delta &= \dfrac{\textrm{400,000,400}-\textrm{400,000,000}}{\textrm{400,000,000}} \times 10^6 \\[4pt] &= \dfrac{400}{\textrm{400,000,000}} \times 10^6 \\[4pt] &= 1\: ppm \label{9} \end{align} \]
So this resonance appears at 1 ppm in the spectrum. There are two things worth noting about the outcome of this calculation. One is that it should be apparent why the ppm scale is preferable to reporting the actual frequencies of absorption. Writing 0 and 1 ppm on the x-axis is preferable to writing 400,000,400 and 400,000,000 Hz. The second is to note the very small frequency difference (400 Hz) that occurs for two resonances that are 1 ppm apart from each other. The resonances in most 1H NMR spectra occur in the range of 0 to 10 ppm (Figure \(\PageIndex{3}\)). On a 400 MHz instrument, this involves a frequency difference of only 4,000 Hz between the two extremes of the spectrum. Note the impressive frequency precision that can be measured on an NMR spectrometer – you would never have to dial in the frequency of a radio station to such a level of precision. These numbers show that the magnitude of Be, which alters the frequency of absorption of different nuclei by only a few hundred Hertz, is so much smaller than the magnitude of BAPPL, which results in an energy gap of 400 MHz.
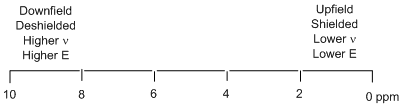
Figure \(\PageIndex{3}\) shows the accepted format for presentation of an NMR spectrum in which 0 ppm is to the far right and 10 ppm is to the far left. Resonances to the right in the spectrum are said to be upfield, more highly shielded, absorb at a lower frequency, and therefore have a smaller energy gap between the ground and excited spin state. Resonances to the left in the spectrum are said to be downfield, more highly deshielded, absorb at a higher frequency, and therefore have a larger energy gap between the ground and excited spin state.
An important consideration is whether anything happens to the magnitude of Be for a particular nucleus when BAPPL is changed. Altering the applied magnetic field ends up altering the rate at which the electrons circulate about the nucleus. At higher values of BAPPL, the electrons circulate faster with the result of a proportionally larger value of Be. This means that a resonance with a chemical shift of 1 ppm on a 400 MHz NMR spectrometer has a chemical shift of 1 ppm on a 100 MHz or 600 MHz spectrometer.
What is different as BAPPL is varied?
Solution
If we consider a resonance at 1 ppm on a 600 MHz, it would be calculated as shown in Eq 10.
\[\delta = \dfrac{\textrm{600,000,600}-\textrm{600,000,000}}{\textrm{600,000,000}} \times 10^6= \dfrac{600}{\textrm{600,000,000}} \times 10^6=1\: ppm \label{10}\]
Note that a 600 MHz spectrometer has 600 Hz in a ppm. From earlier we determined that a 400 MHz spectrometer has 400 Hz in a ppm. So instruments with larger magnets have more Hertz in a ppm.
There are also some unusual shielding effects that occur in compounds with double bonds and aromatic rings. In these cases, the electrons move in a specific circulation pattern in an applied magnetic field. The result of this circulation pattern is that nuclei positioned at the exterior of a double bond or phenyl ring are highly deshielded, whereas nuclei positioned over the double bond or aryl ring are highly shielded (Figure \(\PageIndex{4}\)). The structure of norbornene is also shown in Figure \(\PageIndex{4}\). In norbornene, the hydrogen atom represented as HA is shielded relative to that of HM because it is over the double bond. The hydrogen atoms represented as HX are deshielded given their position on the double bond. Many alkene hydrogen resonances occur in the range of 5-7 ppm. Many aromatic hydrogen resonances occur in the range of 7-8 ppm. These alkenyl and aryl hydrogen atoms are more highly deshielded than would be expected because of the specific circulation pattern of the electrons.
