
4.1: Introduction to Infrared Spectroscopy
- Page ID
- 111678

Infrared radiation is the proper energy to excite vibrations in molecules. The IR spectrum consists of near (4,000-12,800 cm-1), mid (200-4,000 cm-1) and far (10-200 cm-1) regions. The mid-IR region is most commonly used for analysis purposes. Vibrational excitations correspond to changes in the internuclear distances within molecules. You have likely recorded infrared spectra in your organic chemistry course. Thinking back to the instrument you used to record the spectrum, consider the following question.
Can infrared spectra be recorded in air? If so, what does this say about the major constituents of air?
Thinking back to the instrument you used in your organic chemistry course, you presumably realize that no attempt was made to remove air from the system. The beam of infrared radiation passed through the air, indicating that the major constituents of air (nitrogen gas, N2, and oxygen as, O2) either do not absorb infrared radiation or absorb in another region of the spectrum. You likely know that double and triple bonds have strong absorptions in the mid-IR region of the spectrum. N2 and O2 have triple and double bonds, respectively, so it turns out that N2 and O2 do not absorb infrared radiation. There are certainly minor constituents of the air (e.g. carbon dioxide) that do absorb infrared radiation, and these are accounted for by either using a dual beam configuration on a continuous wave infrared spectrophotometer or by recording a background spectrum on a fourier transform infrared spectrophotometer.
Why don’t the major constituents of air absorb infrared radiation? It might be worth noting that a molecule such as hydrogen chloride (HCl) does absorb infrared light.
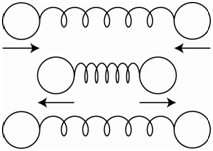
In order for a vibration to absorb infrared radiation and become excited, the molecule must change its dipole moment during the vibration. Homonuclear diatomic molecules such as N2 and O2 do not have dipole moments. If the molecule undergoes a stretching motion as shown in Figure \(\PageIndex{1}\), where the spheres represent the two nuclei, there is no change in the dipole moment during the vibrational motion, therefore N2 and O2 do not absorb infrared radiation.
HCl does have a dipole moment. Stretching the HCl bond leads to a change in the dipole moment. If we stretched the bond so far as to break the bond and produce the two original neutral atoms, there would be no dipole moment. Therefore, as we lengthen the bond in HCl, the dipole moment gets smaller. Because the dipole moment of HCl changes during a stretching vibration, it absorbs infrared radiation.
Describe the vibrations of carbon dioxide (CO2) and determine which ones absorb infrared radiation.
The number of possible vibrations for a molecule is determined by the degrees of freedom of the molecule. The degrees of freedom for most molecules are (3N – 6) where N is the number of atoms. The degrees of freedom for a linear molecule are (3N – 5). Carbon dioxide is a linear molecule so it has four degrees of freedom and four possible vibrations.
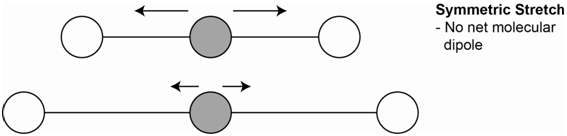
One vibration is the symmetrical stretch (Figure \(\PageIndex{2}\)). Each bond dipole, which is represented by the arrows, does change on stretching, but the overall molecular dipole is zero throughout. Since there is no net change in the molecular dipole, this vibration is not IR active.
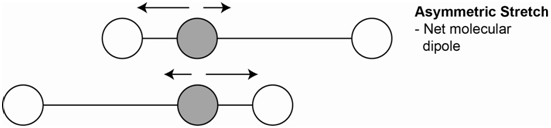
A second vibration is the asymmetrical stretch (Figure \(\PageIndex{3}\)). Each bond dipole does change on stretching and the molecule now has a net dipole. Since the molecular dipole changes during an asymmetrical stretch, this vibration is IR active.
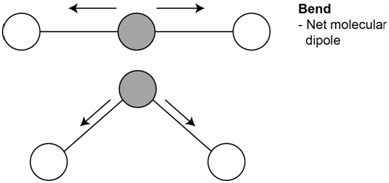
The third vibration is the bending vibration (Figure \(\PageIndex{4}\)). There are two bending vibrations that occur in two different planes. Both are identical so both have the same energy and are degenerate. The bending motion does lead to a net molecular dipole. Since the molecular dipole changes during the bending motion, these vibrations are IR active.
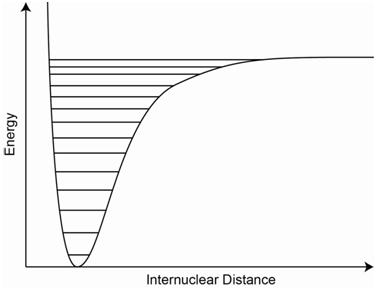
An atomic stretching vibration can be represented by a potential energy diagram as shown in Figure \(\PageIndex{5}\) (also referred to as a potential energy well). The x-axis is the internuclear distance. Note that different vibrational energy levels, which are shown on the diagram as a series of parallel lines, are superimposed onto the potential well. Also note that, if the bond gets to too high a vibrational state, it can be ruptured.
IR spectra are recorded in reciprocal wavenumbers (cm-1) and there are certain parts of the mid-IR spectrum that correspond to specific vibrational modes of organic compounds.
2700-3700 cm-1: Hydrogen stretching
1950-2700 cm-1: Triple bond stretching
1550-1950 cm-1: Double bond stretching
700 -1500 cm-1: Fingerprint region
An important consideration is that as molecules get complex, the various vibrational modes get coupled together and the infrared (IR) absorption spectrum becomes quite complex and difficult to accurately determine. Therefore, while each compound has a unique IR spectrum (suggesting that IR spectroscopy ought to be especially useful for the qualitative analysis – compound identification – of compounds), interpreting IR spectra is not an easy process. When using IR spectra for compound identification, usually a computer is used to compare the spectrum of the unknown compound to a library of spectra of known compounds to find the best match.
IR spectroscopy can also be used for quantitative analysis. One limitation to the use of IR spectroscopy for quantitative analysis is that IR sources have weak power that enhances the noise relative to signal and reduces the sensitivity of the method relative to UV/Visible absorption spectroscopy. Also, IR detectors are much less sensitive than those for the UV/VIS region of the spectrum. IR bands are narrower than observed in UV/VIS spectra so instrumental deviations to Beer’s Law (e.g., polychromatic radiation) are of more concern. Fourier transform methods are often used to enhance the sensitivity of infrared methods, and there are some specialized IR techniques that are used as well.