
Instructor’s Guide – Chromatograms and Mass Spectra
- Page ID
- 120137

Exercise = black text; Key = blue text; Instructor’s Guide = bracketed italicized text with yellow highlight
[Before starting this exercise students should understand the basics of GC and LC separations and have had a brief introduction into mass spectrometry, including instrument design (basic block diagram), ionization sources (EI and ESI), and simple quadrupole or magnetic sector mass analyzers.]
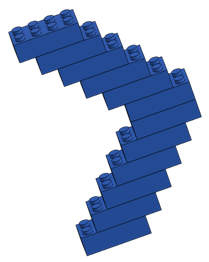
[Build molecules out of large LEGO™ (“Duplo”) bricks or an equivalent snap together building brick (see configurations below). Add one “charge” (round drafting sticker) to a single exterior brick of each molecule; vary the charge placement on each molecule.]
[Print three data sheets (attached) - one for each molecule type (color).]
[Use duct tape to create large axes (retention time vs. mass) on the floor of the space where you will “fragment” the Duplo molecules. The space should ideally have enough room for all the students in your class to view and walk around the plot they will create on the floor. Label the axes with a permanent marker. The time axis can simply indicate the direction of increasing retention time. The mass axis should include numbers from 1 to 16.]


Learning Objectives
After completing these exercises, you will be able to…
(1) Explain the relationship between a total ion chromatogram (TIC), an extracted (or selected) ion chromatogram (XIC), and a tandem (MS/MS) mass spectrum.
(2) Interpret GC-MS and LC-MS/MS data and predict/explain simple fragmentation patterns
Exercise 1
[Set aside ~45 minutes of class time. Exercise 1 works well as an in-class activity; alternatively, it may be used as an exercise directly preceding a laboratory period focused on mass spectrometry.]
Within your group of three, assign and distribute a different color (RED, BLUE, YELLOW) “Duplo” molecule to each person. [If extra molecules are available, it may be helpful to give each group one extra molecule of each color to use as reference when figuring out how each might fragment.]
In the table below, record the number of individual blocks that make up each color. These will represent the molecular masses of your group’s three molecules.
|
Molecular Mass |
|
|
RED |
12 (compact) |
|
BLUE |
12 (branched) |
|
YELLOW |
16 |
- Predict the elution order of the three molecules following GC chromatographic separation. Assume that RED has the lowest boiling point and YELLOW has the highest.
Elution order: 1st_____ RED ____________ 2nd_____ BLUE ___________ 3rd_____YELLOW__________
[Groups may sometimes predict the reverse order. If they do, you might ask the group to think about evaluating the three molecules in terms of volatility. What does it mean that RED has the lowest boiling point of the three? It suggests that it is the most volatile and thus most likely to partition into the mobile (gas) phase, move through the GC column quickly, and be detected first.]
- Figure out where the weak points are within the molecule and evaluate which parts appear to be more exposed
- Should be related to bond strength and stability of molecules and fragments
- Fill in the table below with your predictions for the “masses” (# of blocks) of the likely fragments of each molecule. [Note: each molecule does not necessarily need to form five different mass fragments.]
|
Fragment 1 |
Fragment 2 |
Fragment 3 |
Fragment 4 |
Fragment 5 |
||
|
Molecular Mass |
Mass |
Mass |
Mass |
Mass |
Mass |
|
|
RED |
12 (compact) |
|||||
|
BLUE |
12 (branched) |
|||||
|
YELLOW |
16 |
[Draw a time axis on the board ahead of time or while students are discussing the questions above. It works well if the axis is drawn increasing to the right as is typical for chromatograms.]
Once your group has agreed on an elution order and predicted fragment sizes, bring your intact molecules up to the front of the class and place them in the correct order. If another group has a different elution order than you, discuss your reasoning and come to a consensus.
[At this point all of the RED Duplo molecules should be on stage right, BLUE in the center, and YELLOW on stage left. Each color will have it’s own clear plastic tub. You could discuss the idea that each molecule will have a characteristic “retention” time, but for our purposes here only the order matters.]
[If necessary, this would be a good time to move the class to the space where you’ve taped the time vs. mass axes on the floor and will be fragmenting the molecules. At this point, it is useful to have the students group up according to the color of the molecule they handled in their original group of three (e.g., all those who worked with RED get together; same for BLUE and YELLOW).]
Now let’s look at how each molecule fragments in the mass spectrometer.
[Select one representative for each color to come to the front, pick up their tub and get positioned at the appropriate location on the time axis taped to the floor (Elution order: RED, BLUE, YELLOW). Prompt the class to describe what happens after each color band elutes from the GC column (ionization/fragmentation via EI; a good chance to review how fragmentation happens in EI), then let the representative for the RED group simulate fragmentation by dumping the tub containing all the RED molecules onto the floor from approximately chest height. Have the RED group arrange all of the fragments on the floor in order of mass and perpendicular to the retention time axis. Repeat with BLUE (middle of the time axis) then YELLOW (near the end of the time axis), both from the same approximate height as RED.]
[Note here the importance of the height (a proxy for energy; 70eV for EI) from which the molecules were dropped, both in terms of fragmentation pattern and consistency. You might also ask the students why most GC-MS EI sources are set to 70eV and what will happen if we drop the Duplo molecules from the height of the roof instead (higher energy yields more smaller fragments). Usually the class intuits that fragmentation patterns should be related to the energy of the electron beam in EI, that mass spectra comparison/database matching is only possible if fragmentation patterns are consistent from instrument to instrument, and that higher energies will result in a shift towards smaller fragments.]
- Will every fragment be detected? [Have the students discuss this question with all other students that handled the same color as they did. After students realize that only charged fragments will be detected, have them find the fragments with a round drafting sticker attached (representing a “charge”), and remove all other fragments. Note that based on the location of the charge and the way that each molecule fragments, some fragments will be more likely to be observed by the detector than others. Record the number and mass of each charged fragment for each color molecule (using the data sheet; one sheet per color).]
No, because only the ones with charge will get through the mass analyzer to reach the detector.
- “Each fragment is formed by the breakdown of the next largest fragment.”
[A common misconception among students is that mass spectra reflect the orderly breakdown of the molecular ion into the largest fragment followed by serial fragmentation into increasingly smaller masses. It is worth mentioning that fragmentation patterns are better described in probabilistic terms. Asking students to envision how the Duplo molecules fragmented when dumped on the floor can help them appreciate that some hit the floor first and hardest, while others were “cushioned” or “shielded”; the orientation and timing of each Duplo molecule hitting the floor was different; the actual height from which each was dropped varied slightly due to the starting position of the Duplo molecule in the tub; even the strength of each linkage within two of the same color Duplo molecules is likely to be slightly different. However, each of these differences are layered on top of the inherent defining structural features of each Duplo molecule to determine which fragments dominate.]
- To get the TIC you would sum up all of the charged fragments at every time point along the chromatogram. Ions contribute to the signal if they are within the range of m/z values selected by the mass analyzer.
- An “extracted ion chromatogram” (XIC) displays the intensity of only a particular ion (or ions) of interest over time.
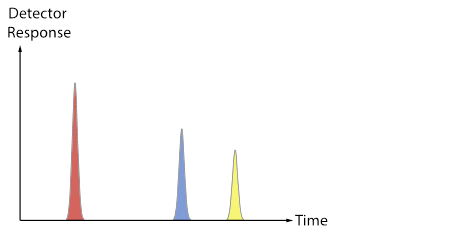
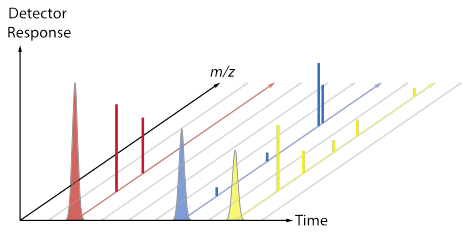
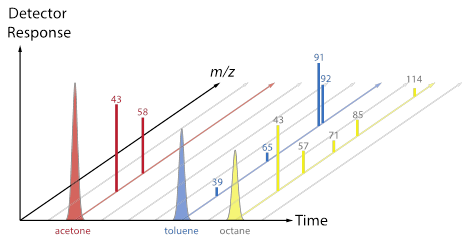
[After groups have some ideas and report out, review the difference between a chromatogram (TIC, XIC) and a mass spectrum. Now use the fragment data sheet to fill in the Excel MS tab, which will show a mass spectrum for each colored molecule. Discuss the convention that spectra are often normalized so that the most abundant peak is set to 100, and point out that each total mass spectrum has a RT associated with it. Does each type of molecule contain a characteristic/unique mass? Are any masses common to more than one type of molecule? The plots below (also included as a pptx file) may be useful as a way to connect the Duplo molecule activity to the “look” of real data from a GC-MS.]
Exercise 2
(Adapted from Bullen, Fitch, Kelly, and Larive, 2013, Environmental Analysis – Lake Nakuru Flamingos: Pesticides, Analytical Sciences Digital Library, Online.) [Set aside ~25 minutes of class time]
Mass spectrometry is widely used in analytical chemistry, forensics, bioanalysis, and environmental analysis. Some advantages of mass spectrometry include its sensitivity and low detection limits. Both qualitative and quantitative results can be obtained using a mass spectrometer. However, mass spectrometers are generally more costly than electrochemical and spectroscopic instruments.
A total ion chromatogram (TIC) was collected by GC-MS for a standard solution containing a mixture of 20 organochlorine pesticides:
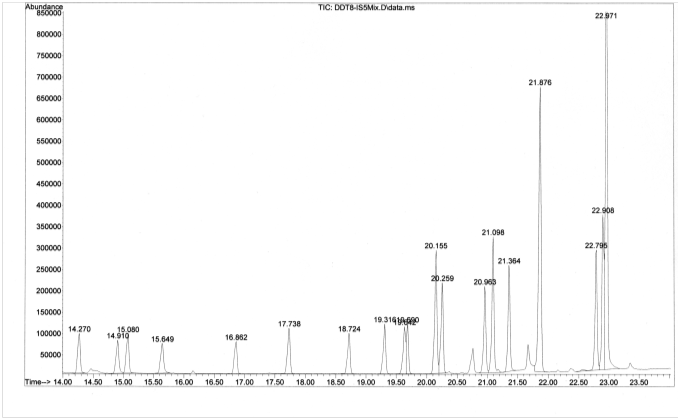
Consider the chromatographic peak at 21.876 min corresponding to the insecticide, DDT.
- List three factors responsible for the broadness of the peak. ]
Longitudinal diffusion, mass transport lags, multiple overlapping compounds
[Students will often come up with the first two answers if they have recently completed a unit on separations and the factors that influence peak broadening. One approach to having students discover the last answer (multiple overlapping compounds) is to ask them to consider the chromatogram at the base of the peak at 21.876 min. They should notice the small peak that overlaps with the peak of interest. Can they know from the TIC alone that other compounds are not co-eluting with the peak of interest? Once students agree that the answer is no, a nice way to reinforce connections to previous material is to ask them to think of ways to determine if the peak was “pure”. Their answers may include techniques to improve chromatographic resolution or utilize MS data to plot an XIC or evaluate mass spectral consistency through the width of the peak.]
- Number of ions that reach the detector (creating electrical signals that can be quantified or “counted”)
- It has to be injected into the instrument, survive the GC column and inlet intact, create ions (molecular ions or fragment ions) in the source, make it through the mass analyzer (quadrupole, TOF, etc.), and reach the detector.
- Neutral molecules are unaffected by the electromagnetic fields used in most mass analyzers.
To help confirm the identity of the peak at 21.876 min as DDT, it would be common to compare a mass spectrum (m/z vs. abundance) from the middle portion of the peak to a reference spectrum for DDT, taken under similar ionization conditions. A useful source for reference EI mass spectra is the NIST Chemistry WebBook.
The NIST mass spectrum (GC-MS; EI; 70eV) of DDT (MW = 354.5 g/mol) is given below.
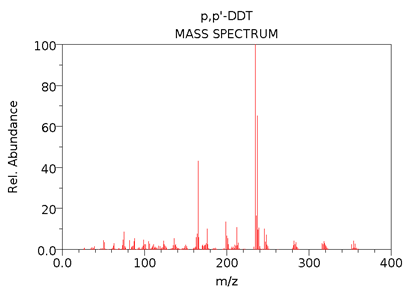
[If time allows, the DDT mass spectrum shown above provides a good opportunity to ask students to explain the y-axis label (“Rel. Abundance”), how it differs from other mass spectra y-axis labels (“Abundance”; “Detector Response”), and the nature of the raw signal used to construct this particular mass spectrum. These questions may also be useful as a way to transition into a subsequent discussion about mass analyzers and detectors. Some students might also notice that the molecular ion peak (and others) appear as a groups of peaks, a feature that can be used to talk about characteristic isotope patterns common for halogen-containing compounds.]
- The masses of the molecular ion cluster would be 8 units higher. Depending on where the deuterium labels were placed, you would also expect increases (of 0 to 8 units) in fragment m/z values.
[Students sometimes assume that all fragments of DDT-d8 will be 8 units higher. To correct this misunderstanding, ask students to imagine where the deuterium atoms might be located on the DDT structure then predict where the deuterium atoms will be when the structure fragments. Students should recognize that fragments can’t all increase by 8 and some fragments (those without a deuterium label) may not increase in mass at all compared to the unlabeled DDT.]
We often use internal standards to correct for instrument variability and losses during sample processing. Ideally, the internal standard is an isotopically labeled version of the analyte of interest. For example, if you were analyzing a water sample for DDT concentration, you might inject a known amount of DDT-d8 at the time of collection, then prepare your sample (e.g., extract, concentrate, clean up) for injection on the GC-MS.
- Yes, the problem is that DDT and DDT-d8 will probably co-elute (you might see only one peak in the TIC at 21.876 min), so you wouldn’t be able to quantify either one. You could solve the problem by picking one or two fragments that are specific to DDT, and then have the computer sum them up at each time along the chromatogram, ignoring all the other fragment m/z values. This new (simplified subset) chromatogram is called an extracted (or selected) ion chromatogram (XIC). You could then do the same thing using fragment m/z values specific to DDT-d8. This would allow you to separate the DDT peak (XIC) from the DDT-d8 peak (XIC) and integrate (quantify) each.
Exercise 3
[Set aside ~25 minutes of class time]
In 2010, the Deep Water Horizon oil spill released 5 million barrels of crude oil into the bottom waters of the Gulf of Mexico. One strategy to minimize surface slicks was to release chemical dispersants (i.e., surfactants) into the water by plane or into the deep water near the wellhead, 5000 feet below the surface. This was the first time that dispersants were released into deep water on a large scale (2.1 million gallons of dispersants), so there was considerable uncertainty about what would happen to the dispersant chemicals over time. The following figure was taken from a paper titled “Fate of Dispersants Associated with the Deepwater Horizon Oil Spill” by Elizabeth Kujawinski et al. (2011).
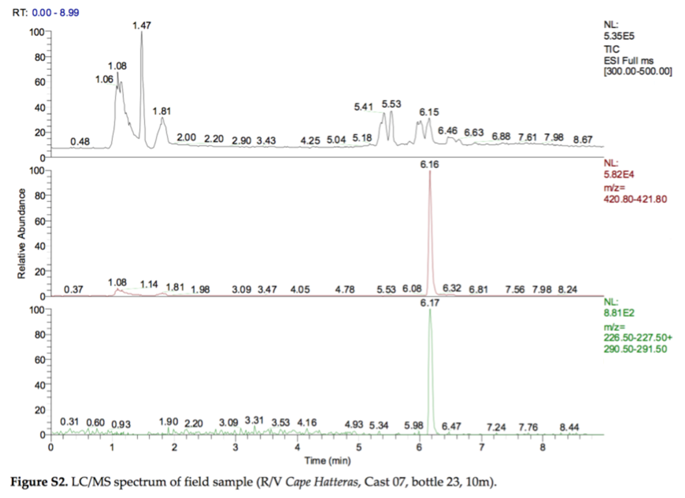
- Bottom plot: Shows the XIC for two fragments (m/z 227 and m/z 291) of the m/z 421 molecular ion
y-axis: relative abundance (signal intensity adjusted so that the highest value is 100)
NL: normalization level: the actual signal intensity (e.g., counts per second) for the highest value
ESI: electrospray ionization (negative mode)
Bonus: The figure shows chromatograms, not spectra.
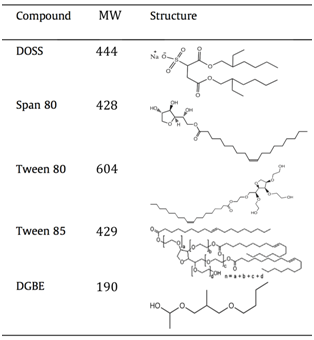
- DOSS (dioctyl sodium sulfosuccinate): The observed m/z value for the molecular ion at 6 min is consistent with ionization via the removal of a hydrogen atom from DOSS, which we would write as [DOSS – H]–. The fragment ions’ (m/z 227 and 291) retention time aligns with that of the molecular ion and both are plausible fragments based on the structure of DOSS. Kujawinski confirmed their assignment by injecting a pure standard solution of DOSS and observing the same fragments and retention times.
[In the table, DOSS is shown as the sodium salt (MW 444 g/mol). If students are confused about why this produces a molecular ion with m/z 421, ask them to describe what will happen to the sodium salt under ESI(–) conditions. They typically realize that the sodium salt of DOSS will form the [DOSS – H]– molecular ion, and the positive sodium ion (MW 23) will not be observed or attached.]
- They determined the peak area in the XIC for m/z 421 then used a DOSS calibration curve to calculate the concentration. Why not use the fragment ions? Because they give less signal, thus have lower signal to noise ratio, and likely a higher LOD.
In fact, the data from Figure S2 were collected using a liquid chromatograph coupled to an ion trap mass spectrometer operated in MS/MS mode. In this mode, the mass spectrometer uses the mass analyzer (an ion trap) to isolate ions of one particular m/z, fragment them, then sort/detect the resulting fragment m/z values. In this way Kujawinski et al. were able to create an MS/MS spectrum (not shown), which plots the m/z values for the fragments of the selected ion. The bottom panel in Figure S2 shows the XIC for two characteristic fragments (m/z 227 and m/z 291) of the molecular ion m/z 421.
- -To determine the structure of an unknown organic compound by fragmenting the molecular ion, collecting those fragments, fragmenting the fragment ions, collecting those fragments, and so on. This process can continue n times and is thus sometimes referred to as MSn.