
Comparing Analytical Methods: Cocaine Determination in Urine
- Page ID
- 85404

Article: D.L. Phillips, I.R. Tebbett, and R.L. Bertholf, “Comparison of HPLC and GC-MS for measurement of cocaine and metabolites in human urine” J. Anal. Toxicol. 1996, 20, 305-308.
This article compares two different methodologies, HPLC with UV absorbance detection and GC-MS for the quantification of cocaine and its metabolites in urine. The assignment is designed so that no prior knowledge of the separation mechanisms of HPLC and GC is needed. Similarly, minimal background knowledge about MS is needed. Before the students start their discussions, I check to make sure they have understood that MS detection provides much more detailed structural information about the analyte compared to UV absorbance. The assignment is designed to highlight the figures of merit used to compare two techniques: measures of sensitivity, precision, LOD and LOQ, etc. The methods used also provide an opportunity to discuss matrix effects, use of an internal standard, and statistical analysis of data. Additionally, because these topics are typically covered early in the analytical curriculum, when students might first be encountering the primary literature, some questions are included to draw students’ attention to certain conventions of writing in the scientific literature.
Out-of-Class Questions
Several questions in this assignment (Q1, Q3, Q4) are designed to draw students’ attention to the structure of a scientific article and important conventions in scientific writing for the literature. The remaining questions review important concepts in method calibration and statistics or ensure that students have the necessary background for in-class discussion.
Q1. Using only the information in the abstract, answer the following questions about this work.
(a) What did the authors do?
The authors compared HPLC to GC-MS for detection and determination of cocaine and its metabolites.
(b) Why did they do it?
The aim of the study was to evaluate whether HPLC is a useful alternative to GC-MS for this application.
(c) How did they do it?
The authors used solid phase extraction followed by either HPLC or GC-MS on samples of urine with bupivacaine added as an internal standard. The methods were compared based on sensitivity, precision, and dynamic range.
(d) What did they find?
They found that HPLC is a useful alternative to GC-MS.
Q2. Fill in the table below using the information from the introduction.
(This question prepares students for in-class discussion questions Q4 and Q5.)
|
GC-MS |
HPLC-UV |
|
|
Advantages |
High specificity Currently the accepted method |
Very sensitive methods available DAD gives spectral information Low cost Technology is improving |
|
Disadvantages |
Analytes must be volatile and therefore often require derivatization |
No UV detection of the metabolite ecgonine methyl ester available, more susceptible to matrix interferents |
Q3. Toward the end of the introduction, often in the last paragraph, it is common to transition from background information to a brief summary of the specific question addressed in the manuscript. What question did these authors want to answer?
From p. 305, “The purpose of this work was to determine whether HPLC analysis of urine samples containing cocaine and metabolites produced comparable precision, sensitivity, and reproducibility to GC-MS analysis of the same samples.
Q4. Skim the Materials and Methods section with a focus on what types of details are included. Check the boxes to indicate which pieces of information below are in the methods section, and be sure to note the level of detail.
Discussing this question in class is a useful opportunity to clarify the differences in format and detail between lab manual protocols, procedures recorded in lab notebooks, and the methods sections of journal articles.
■ chemicals used
□ glassware used
■ concentrations of solutions
■ instruments used
■ operating parameters for instruments
■ manufacturers of supplies
□ sample calculations for how to make stock solutions or dilutions
■ description of data analysis procedures
□ results of the experiment
Q5. Why do the authors spike the standards into a urine sample instead of diluting them in water or buffer?
Spiking the standards into a urine sample helps to keep matrix effects constant between samples and calibration standards.
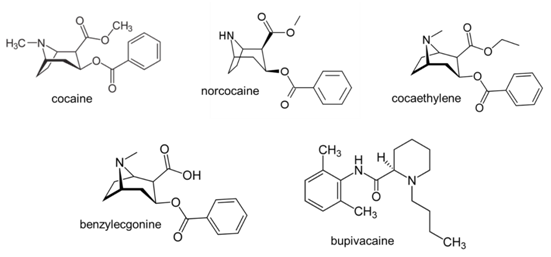
Q6. Look up the structures of the analytes and bupivacaine and record them.
(This question ensures that students have information required to evaluate the suitability of the internal standard in class.)
Q7. For their statistical analysis, why did the authors use paired t-tests?
As noted on p. 306, the same samples were used for each method after being split in half after the SPE step. This is a common experimental design for comparing two methods and means that a paired t-test is appropriate.
Q8. How did the authors define the limit of quantitation (LOQ)? What is the typical way to define LOQ?
(This question asks students to recognize that the LOQ determination in this paper may not match the methodology described in previous classes. If desired this question can be moved to the in-class assignment and used to prompt discussion about practical considerations of false positive and false negatives in determining the best way to assess LOD and LOQ for a specific application.)
On p. 307, the authors defined the LOQ as five times the LOD. [The LOD was determined empirically by running samples of progressively lower concentration until the signal was not consistently detected.] A typical textbook definition of the signal LOQ is 10 standard deviations above the blank. The concentration LOQ is then 10sbl /m. With the standard definition of LOD as 3sbl /m, the LOQ is typically defined as 3.33 times the LOD.
Q9. What metric was used to compare the precision of the data? What was used to evaluate sensitivity?
(This question prompts students to identify the interday variation in the slope as a metric for precision and the slope itself as the metric for sensitivity. As students discuss in-class Q2, I encourage them to consider their responses to this question. Note that the authors use the term “analytical sensitivity” in referring to the interday variation of the slope (calibration sensitivity), which may confuse students who have learned that analytical sensitivity, γ, refers to the calibration sensitivity, m, divided by the standard deviation of the signal for a given calibrator.)
As noted on p. 307, the authors use the interday variability of the average coefficient of variability for all calibrators to evaluate precision. [The coefficient of variation, CV, is the relative standard deviation expressed as a percent.] These values for each calibrator were averaged, and then the average value and standard deviation were used to perform a paired t-test to determine whether there was any difference in precision between the methods. This measure of precision emphasizes day-to-day reproducibility.
Also on p. 307, the authors state that the average slope for each analyte was used to evaluate sensitivity. Again, a t-test was used to determine whether there was a significant difference in sensitivity for each method.
In-Class Questions
Q1. Consider the structures of the analytes and bupivacaine that you looked up outside of class. What was the purpose of the bupivacaine in this analysis? Do you think this compound was a good choice for this purpose? Explain.
Students should consider the presence of acidic and basic groups, hydrophobicity, molecular weight, etc. Because the internal standard is expected to behave similarly to the analytes, students should also consider relative retention times of the analytes and internal standard in Figures 1 and 2. Students may also consider the possibility of including a second internal standard that can be derivatized like BZE and NC for GC analysis to account for incomplete derivatization of these analytes.
If students conclude that bupivacaine is not sufficiently similar to the analytes, it may be helpful to prompt students to consider challenges to identifying an internal standard that is more structurally similar to the analytes. For example, one must be certain that the internal standard cannot possibly occur in the samples due to cocaine metabolism. Time-permitting, you may give the students an opportunity to search the literature for internal standards used in other studies of cocaine metabolites. (They may be surprised to find that for GC-FID studies the most commonly used internal standards may be even less structurally similar to cocaine than bupivacaine.)
Q2. The authors state that “Overall, GC-MS demonstrated better precision than HPLC, but the methods had generally equivalent sensitivities.” Consider the data in Tables 1 and 2. Do you agree with the authors’ statement? Why or why not? What additional data might be useful in comparing the two methods’ sensitivity and precision? What other information might you want to know when choosing a method for your application? Is this information provided in the manuscript?
This question asks students to make a global assessment of the data in Tables 1 and 2. It is important to ensure that the students understand their answers to out-of-class Q9 before this discussion gets underway. The authors provide their interpretation in the text, but this question is actually fairly complex when one considers the standard deviations of the slopes reported in Table 1. Students should be encouraged to consider all the data rather than relying on the authors’ conclusions. Based on Table 2, GC-MS is more precise, as the individual calibrators appear to agree well from day-to-day based on the average CV values reported. However, the slopes for the GC-MS calibration curves had much larger variation than those for HPLC, as seen in Table 1. Students may consider whether reporting the analytical sensitivity, γ, in addition to the slope would be useful, as this metric considers both sensitivity and precision. Some students may bring up the LOD values presented at the end of the paper, giving an opportunity to underscore the distinction made by analytical chemists in discussing sensitivity and LOD.
Q3. Do you agree with the authors’ conclusion that HPLC with UV detection is a suitable alternative to GC-MS for analysis of cocaine in urine? Consider this conclusion generally and in the context of the following scenarios. Decide whether you would recommend HPLC-UV or GC-MS for each analysis, and justify your choices.
- You manage a small business. The owner of the company decides to require drug testing for cocaine for all new hires.
- You are working on a research project to study how genetic variation in rats affects the metabolism of cocaine.
This question asks students whether they agree with the paper’s conclusion, which is that HPLC is a useful alternative to GC-MS. Rather than treating this as a question with “correct” answers, students should be encouraged to consider this conclusion critically and use data and experience to support their answer. For example, students who are familiar with derivatization as a sample preparation step may bring up issues of cost and time associated with this technique. I often find it useful to direct students to both the text and the tables and to instruct them to consider all the available data in their decision. The first paragraph of the Results on p. 307 of the article discusses the specificity of each method. The last paragraph of the Results on p. 307 discusses the agreement between the tested methods and the results of an established drug lab. The LOD data are at the end of the Discussion. Students should also be encouraged to consider the ramifications of a false positive in each situation. In summarizing the class discussions, I explain that GC-MS is commonly used as a confirmatory tool in drug testing because of the structural information provided by MS. For this reason, GC-MS is likely the best of the two options for scenario (a), while HPLC-UV may be acceptable or even preferable for scenario (b).
Q4. Since this article was published, a method that readily couples HPLC to MS, called electrospray ionization, has become much more widely available. What would be the advantages of this method for this application?
If needed, students can be referred back to Q2 from the out-of-class questions, which highlights the advantages and disadvantages of each technique. Depending on students’ familiarity with HPLC, GC, and MS, it might be helpful to briefly discuss the difference between a separation technique and a detection method. This should lead into a discussion of how HPLC-MS combines the minimal sample preparation of HPLC with the structural information available by MS.