
QuEChERS
- Page ID
- 156303

QuEChERS and the Dirty Dozen
You’re walking through the produce aisle at the grocery store and wonder: “Which organic fruits, veggies are worth spending more on?” This was the title of a recent Omaha World Herald article.1 You can also find similar articles on the web at organic.org2 (The Dirty Dozen) and Good Housekeeping3 (The New Dirty Dozen: 12 Foods to Eat Organic.)
The terms “The Dirty Dozen Plus” and “The Clean Fifteen” have been trademarked by the Environmental Working Group (EWG) in their Shopper’s Guide to Pesticides in Produce.4 Articles such as these are geared toward the general public. As scientists, let’s take a closer look at these articles and determine from where they obtained their information and how this information is being utilized.
Q1. EWG compiles these lists every year. Find a recent list and write down the top five produce types most likely to contain pesticides. Note: Reference 4 is a great place to start your research. If you scroll down and click “see the list” you should be able to access a recent list without registering at the website.
Q2. How do you suppose the EWG came up with the “Dirty Dozen” list? At the top of the page at the site ( http://www.ewg.org/foodnews/ ) click on “Read the Report” and you should be provided with the Executive Summary. Read through the first few paragraphs of this document.
A) What group carried out the testing of produce for pesticides?
B) Read through the document and scroll down to the “Methodology” section. What metrics did they use to rank the foods? You should find six metrics.
C) There are some references to the pesticide data from the United States Department of Agriculture (USDA) at the end of the Executive Summary. List the relevant references along with brief descriptions of what they contain.
Q3. Find any recent USDA Pesticide Data Report online. The website for the Pesticide Data Program (PDP) is www.ams.usda.gov/AMSv1.0/pdp (Databases and Annual Summary Reports). Note, you should scroll to the middle of the page to “PDP Annual Summary Reports” and click on a specific report. In the 2010 Report, Table 1 (page 15 of the pdf file) lists the commodities sampled and tested. Did they test any produce that made your top 5 list in question 1?
Q4. In the report, Refer to Appendix B: Distribution of Residues by Pesticide in Fruit and Vegetables (or search the pdf for the fruits or vegetables you listed in Q3). Which pesticides were detected on these? Make a table structured like the one below. Note, some fruits or veggies may have more than one pesticide detected on them. Choose two produce items for your table and list 3-5 pesticides for each. Also find the percent of samples that contained each pesticide along with the concentration range and tolerance limit.
Table 1: Pesticides Found on Fruit and Veggie Samples
|
Fruit/Veggie |
pesticide |
% of samples |
Conc. Range (ppm) |
EPA tolerance (ppm) |
|---|---|---|---|---|
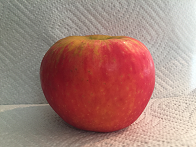
A review of years of PDP data would reveal that apples are consistently at the top of the “Dirty Dozen” list.
Q5. Look at your table from Q4 and list three to four pesticides most detected on apples. Did any samples contain levels above the EPA tolerance?
Q6. To get an idea of the chemical and physical properties of these four pesticides most detected on apples, look up their chemical structures on Pubchem (https://pubchem.ncbi.nlm.nih.gov/ ) and draw below or insert into your data table. Additionally, in the Chemical and Physical Properties section, find information on the pH stability and the pKa (dissociation constant) of each of the four pesticides.
You’ve now seen that pesticide residues have been detected and quantitated on many of the fruits and vegetables you find at the grocery store. As a student studying analytical chemistry, you are probably wondering what technique was used to identify and quantitate the pesticide residues. Many of these measurements were made using some form of gas chromatography coupled with mass spectrometry (GC-MS) or liquid chromatography with MS detection. You already know that you can’t inject an apple on a GC and that some form of sample preparation is needed. So once again . . .
|
A) How do you get your sample from this form… |
B) To a form suitable to inject on the GC . . . |
|
|
|
It may be wise to change the caption in part A) above to “How do you get 1000’s of samples from this form . . . “ Looking through the PDP literature, you can see that an extensive amount of samples were collected, prepared and analyzed throughout the United States. From the dates of the reports, you can also see that this is done annually. So at this point, you know we have a complex sample and multiple analytes. Note that the pesticides are also referred to as “residues” in the pesticide analysis lingo. An analysis that determines the concentration of multiple analytes is called a “multi-residue” analysis.
Q7. Name both practical obstacles and requirements for this type of multi-residue sample preparation and quantitation on fruits and veggies. Especially think about the sample preparation and extraction step.
Q8. Name some important analytical requirements for this type of multi-residue sample preparation and pesticide quantitation on fruits and veggies. Especially think about the sample preparation and extraction step.
Q9. Consider the sample preparation and extraction techniques you have learned about so far in this module. Are there any that may be applicable to multi-residue pesticide analysis? Are there any that would be a poor choice?
Sample Preparation Background
As you have seen in the previous sections of this module, some drawbacks of conventional extraction techniques, particularly LLE, are the use of large volumes of organic solvents and the long sample preparation times. In fact, Waters Corporation estimates that 60% of analytical work activity and operating cost can be spent on sample preparation procedures.5 In the solid phase extraction (SPE) section, you learned how SPE uses less solvent and makes sample preparation more efficient. However, SPE can be both costly and complex to implement, and method development can take a long time.
The sample preparation approach of QuEChERS (pronounce “ketchers”) was originally designed to improve the efficiency of pesticide extraction from fruits and vegetables.6 The method has been improved upon7, and there are now many other applications of the QuEChERS process, particularly for samples containing little to no water. The acronym stands for Quick, Easy, Cheap, Effective, Rugged, and Safe. It has been estimated that a single analyst can prepare 8 samples in 45 minutes using disposable materials worth only a few dollars or euros.8 QuEChERS uses much less solvent than the other extraction methods and uses no chlorinated solvents.9
How QuEChERS works
A QuEChERS extraction involves two steps.
1) The first step is a liquid-liquid extraction via a “salting out” step in acetonitrile.
2) The second step is a dispersive SPE (d-SPE) cleanup step to remove polar interferents.
In the previous sections of this module, you have learned about the theory behind both LLE and SPE. To see how these are combined in the QuEChERS process, click here10 to watch a video showing the procedure. The video lasts approximately 6 minutes. Watch the entire video and answer the following questions to make sure you understand the process. The webpages at references 9 – 12 are also helpful for understanding the specific steps in the process.
Q10. Find the structure of acetonitrile and look up the density. Water and acetonitrile are generally miscible, but the high concentration of salt added causes a phase separation between acetonitrile and the salt water.11 Would you expect acetonitrile to be the top or bottom layer in a LLE with the salt water?
Q11. Fill in the second column of the table below with the description of each step.
Table 2: Steps of a QuEChERS Procedure
|
Step |
Description |
Additional Information |
|---|---|---|
|
1 |
--------- |
|
|
2 |
||
|
3 |
||
|
4 |
||
|
5 |
||
|
6 |
||
|
7 |
------- |
Q12. Add the following details to the “Additional Information” column.
A. What mass of sample should be added to the 15 mL centrifuge tube prior to adding extraction solvent?
B. What volume of extraction solvent is added for each gram of sample?
C. What are the identities of two types of buffering salts?
D. After the extraction into acetonitrile, what volume of supernatant is added to the 2 mL centrifuge tube? What volume is added to the 15 mL centrifuge tube?
E. In the centrifuge cleanup tube, which layer contains the analyte? Which layer contains the sorbent?
Q13. According to the video, do you expect the majority of your interferents to be polar or non-polar? Think about the compounds you may find in a fruit or veggie sample. What might be the identity of an interferent in a fruit sample?
Q14. What is the purpose of adding the buffer salts?
Q15. After the first QuEChERS tube is centrifuged, there are four layers. Label them below and note which layer contains your analyte.
Table 3: Layers formed in the first QuEChERS Tube
|
Top layer = |
|
|
Middle layer = |
|
|
Middle layer = |
|
|
Bottom layer = |
Q16. The next step is to remove an aliquot of the top (liquid) layer and transfer to a subsequent centrifuge tube. The tube size choices are 15 mL and 2 mL. What analytical figure of merit can the 15 mL cleanup tube improve?
Q17. The cleanup step consists of adding “sorbents” to the analyte-acetonitrile aliquot. Why is this called dispersive SPE (d-SPE)? Specifically explain the identity of the sorbent and its purpose.
Q18. Another supplier of QuEChERS, Teledyne Tekmar, notes that C18 is incorporated into the sorbent for higher fat samples. Explain.
Q19. As you know many fruits and vegetables are highly colored. What additional sample preparation step can be applied to samples such as peppers, carrots and spinach, which contain large amounts of chlorophyll and carotenoids.
Q20. During the cleanup step, MgSO4 is also added with the “sorbent”. What it its purpose?
Summary
We’ve just gone through a lot of information. If you need to, fill out the table below to keep track of which sorbent removes which interferents.
Table 4: QuEChER d-SPE sorbent and interferents removed
|
sorbent |
Interferent removed |
|---|---|
Summary Questions
Q21. Propose a procedure for extracting pesticides from a sample of peaches (88% water). Also indicate at which step you would add internal standard. Consult one of the USDA Pesticide data reports (Appendix B) and also provide expected pesticide levels. Write out the general steps below. Include the identities of three pesticides you expect to detect on over 20% of your samples and cite your reference. Note, that the “find” function in your pdf reader is helpful for searching a specific commodity.
Q22. How would you modify your procedure in Q21 if you were analyzing oats for pesticides?
Q23. You learned about determining the percent recovery of an extraction procedure in the SPE section. Propose an experiment for determining the percent recovery of a QuEChERS extraction of pesticides from grapes.
Calculation Questions
Use the following procedure to answer the next two questions.
A lab analyst followed the following general procedure while performing a QuEChERS sample preparation for validating a method for determining pesticides in apples. Note that the QC (quality control) samples will be used to determine the % recovery of the extraction. For determination of the %recovery, organic apples presumed to contain no pesticide residues were used.
Extraction: A 15.0 g previously homogenized sample was placed into a 50 mL centrifuge tube. QC samples were fortified with 100 μL of appropriate pesticide QC spiking solution yielding QC samples. One hundred microliters of IS spiking solution (15 μg/mL of TPP) were added to all samples except the control blank. Note, the two pesticides in which we are interested are diphenylamine (DPA) and thiabendazole (TBZ). The solution concentration and aliquot volumes are shown in Table 5.
Tubes were capped and vortexed for 1 min. Next, 15.0 mL of 1% acetic acid in acetonitrile (ACN) were added to each tube using the dispenser. To each tube, a buffered extraction packet from the kit containing 6 g of anhydrous MgSO4 and 1.5 g of anhydrous sodium acetate, was added directly to the tubes. The tubes were shaken vigorously for 1 min by hand to ensure that the solvent interacted well with the entire sample and crystalline agglomerates were broken up. Sample tubes were centrifuged at 4000 rpm for 5 min.
Table 5: QuEChER Sample Preparation for Method Validation and Unknown Sample
|
Sample |
TPP spike conc. (μg/mL) |
TPP vol. (μL) |
Conc. of 100 μL DPA |
Conc. of 100 μL TBZ |
Conc. (ng/g) DPA/TBZ |
Conc. (ng/g) TPP |
|---|---|---|---|---|---|---|
|
QC 1 (spiked organic) |
15.0 |
100 |
1.50 μg/mL |
1.50 μg/mL |
||
|
QC 2 (spiked organic) |
15.0 |
100 |
7.50 μg/mL |
7.50 μg/mL |
||
|
QC 3 (spiked organic) |
15.0 |
100 |
30.0 μg/mL |
30.0 μg/mL |
||
|
Control Blank |
-- |
-- |
-- |
-- |
-- |
-- |
|
Unknown sample |
15.0 |
100 |
-- |
-- |
D-SPE Sample Cleanup. A 1.00 mL aliquot of the upper ACN layer was transferred into a QuEChERS AOAC 2 mL dispersive SPE tube. This 2 mL tube contained 50 mg of PSA and 150 mg of anhydrous MgSO4. The tubes were tightly capped and vortexed for 1 min. The 2 mL tubes were centrifuged with a micro-centrifuge at 13000 rpm for 2 min. An aliquot from the extract (500 μL) was transferred into an autosampler vial. The samples were then ready for GC/MS analysis.
Q25. Use the appropriate information in Table 5 to calculate the concentration (ng/g) of each compound (TPP, DPA and TBZ) spiked into each QC apple sample and the concentration of internal standard TPP in the unknown apple sample in units of ng compound /g apple. You may enter your results in the table.
Calibration Curves
The quantitation method commonly used for these methods is internal standard method, using the compound triphenyl phosphate (TPP) as an internal standard. Calibration curves, spiked in matrix blanks, were made at levels of 5, 10, 50, 100, 200, and 250 ng/g. (Table 6) The TPP (IS) was used at the level you calculated in Q25. The calibration curves were generated by plotting the relative responses of analytes (peak area of analyte/peak area of IS) to the relative concentration of analytes (concentration of analyte/concentration of IS).
Table 6: Calibration Curve Data for Pesticide Analysis
|
Analyte |
1 mL dSPE regression equation |
R2 |
|---|---|---|
|
Thiabendazole |
y = 0.0132x + 0.0002 |
0.9968 |
|
Diphenylamine |
y = 0.0110x + 0.0003 |
0.9995 |
Table 7: GC/MS Peak Area Data for Pesticide Analysis
|
Sample |
DPA/TPP Peak Area |
TBZ/DPA Peak Area |
Conc. of 100 μL DPA |
Conc. of 100 μL TBZ |
Conc. (ng/g) DPA or TBZ |
Conc. (ng/g) TPP |
|---|---|---|---|---|---|---|
|
QC 1 (spiked organic) |
0.1032 |
0.1264 |
1.50 μg/mL |
1.50 μg/mL |
||
|
QC 2 (spiked organic) |
0.5032 |
0.6120 |
7.50 μg/mL |
7.50 μg/mL |
||
|
QC 3 (spiked organic) |
2.313 |
2.678 |
30.0 μg/mL |
30.0 μg/mL |
||
|
Control Blank |
-- |
-- |
-- |
-- |
-- |
-- |
|
Unknown sample |
1.564 |
3.123 |
-- |
-- |
Q26. With any sample preparation procedure, an analyst is concerned about potentially losing sample during the process. The purpose of the QC samples was to determine the % recovery of the procedure. Use the calibration curve data in Table 6, the spike concentration data you determined in Q25, and the peak area data in Table 7 to determine the % recovery of DPA and TBZ at each concentration level.
|
Level (ng/g) |
%DPA |
%TBZ |
|---|---|---|
|
10.0 |
||
|
50.0 |
||
|
100 |
Q27. After the % recovery of the method was determined, it was used to determine the concentration of DPA and TBZ (ng/g of apple) in an unknown apple sample (conventionally grown) obtained from the grocery store. Use the calibration curve data and peak area ratio data in the table to determine the amounts of DPA and TBZ in this apple sample.
References, QuEChERS
- Loza, Josie; Which organic fruits, veggies are worth spending more on? Omaha World Herald article, March 26, 2014 (www.omaha.com/momaha/blogs/which-organic-fruits-veggies-are-worth-spending-more-on/article_5b8d1f5a-7a2f-5169-aeeb-5f50a011ca23.html, accessed September 13, 2018)
- Organic.org “Dirty Dozen” list http://www.organic.org/articles/showarticle/article-214 (accessed September 13, 2018)
- Shapely, Dan; The New Dirty Dozen: 22 Foods to Eat Organic, Good Housekeeping, January 31, 2015 http://www.goodhousekeeping.com/recipes/healthy/dirty-dozen-foods#slide-1 (accessed September 13, 2018)
- Food News: EWG's 2016 Shopper's Guide to Pesticides in ProduceTM (http://www.ewg.org/foodnews/ )
- Aistars, A. Solid Phase Extraction: Principles, Foundations, Examples & Troubleshooting; Pittcon 2014.
- Anastassiades, M.; Lehotay, S.J.; Stajnbaher, D.; Schenck F.J., Fast and easy multiresidue method employing acetonitrile extraction/partitioning and "dispersive solid-phase extraction" for the determination of pesticide residues in produce. J. AOAC. Intl. 2003, 86, 412-431. First report of QuEChERS for pesticide analysis by USDA scientists.
- AOAC 2007.01 and European Method EN 15662
- General QuEChERS procedure for pesticide extraction from fruits and vegetables. http://quechers.cvua-stuttgart.de/ (accessed September 13, 2018)
- Stevens, Joan; QuEChERS 101: The Basics and Beyond, Agilent eSeminar https://www.agilent.com/cs/library/eseminars/Public/QuEChERS_101-%20The%20Basics%20and%20Beyond.pdf (accessed September 13, 2018)
- Waters Corporation video, “Simplifying your Solid Phase Extraction using DisQuE Sample Preparation Products http://www.waters.com/waters/en_US/QuEChERS-Dispersive-Solid-Phase-Extraction/nav.htm?cid=10072671 (accessed September 13, 2018)
- Sigma Aldrich QuEChERS (Dispersive SPE) technical resources: http://www.sigmaaldrich.com/analytical-chromatography/sample-preparation/spe/dispersive-spe-tubes.html (accessed September 13, 2018)
- Teledyne Tekmar QuEChERS tutorial “The Basics: QuEChERS Step by Step: http://blog.teledynetekmar.com/blog/bid/350968/The-Basics-QuEChERS-Step-by-Step (accessed September 13, 2018)