
Exploring fundamental relationships in spectrophotometry
- Page ID
- 241482

Solutions of gold nanoparticles appear colored which means they are absorbing light in the visible range. Since you will be investigating the optical properties of gold nanoparticles using a technique called spectrophotometry, we will briefly review how a spectrophotometric measurement takes place.
Q1. What wavelength range constitutes the visible region in the electromagnetic spectrum?
When a beam of electromagnetic radiation passes through a sample, most of the radiation is transmitted but, at specific wavelengths, the radiation may be absorbed by chemical constituents within the sample. For an atomic or molecular species, the absorption of light causes valence electrons to be excited from lower to higher energy states. For this transition to occur, the energy provided by the radiation has to match the difference in energy (ΔE) between the lower and higher energy states.
The amount of light transmitted through a sample is measured by the transmittance and is represented by the equation:
\[\mathrm{T = \dfrac{P}{P_0}}\nonumber\]
where P0 represents the radiant power of the beam before the sample and P the power after the sample. Another commonly used measurement is the absorbance which is related to the transmittance through a logarithmic relationship:
\[\mathrm{A = - \log T = - \log \dfrac{P}{P_0} = \log \dfrac{P_0}{P}}\nonumber\]
Relationship between absorbance and concentration
It is possible to make quantitative measurements using UV-VIS spectrophotometry because of the linear relationship between absorbance and concentration. This relationship is known as Beer’s law and is represented by the equation:
\[\mathrm{A = εbc}\nonumber\]
where
- A is the absorbance
- ε is the molar extinction coefficient (with units of M-1cm-1)
- b is the path length of the cuvette (cm)
- c is the concentration (Molarity)
The changes in absorbance with changes in concentration of a sample are measured at λmax which is the wavelength of maximum absorption in the spectrum of the compound being analyzed. By plotting A as a function of varying concentrations of the analyte, a regression curve can be established.
Q2. Draw a representative plot of A versus c.
Q3. How could you use this plot to determine the molar extinction coefficient of the analyte being investigated?
For a discussion of fundamental concepts of UV-VIS spectrophotometry check the following links:
- http://www.asdlib.org/onlineArticles/ecourseware/Analytical%20Chemistry%202.0/Text_Files.html
- Understanding Chemistry – UV-VIS Spectroscopy
The molar extinction coefficient can be linked to the intensity of light absorption. For example, transition metals and dyes appear brightly colored because some transitions in the visible range are highly probable and have very large extinction coefficients. For example, the extinction coefficient of the bright Bromothymol Blue at 615 nm is approximately 3.5 x 10⁴ M-1cm-1. Gold nanoparticles are also intensely colored and their color as well as its intensity is controlled by their size (Figure 2).
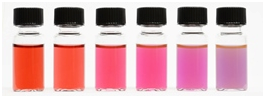
Figure 2. Colors of various sized monodispersed gold nanoparticles – Source: http://www.sigmaaldrich.com/material....kwu2f19v.dpuf
Table 1. Effect of particle size on maximum wavelength of absorbance and molar extinction coefficient of gold nanoparticles.
|
Diameter (nm) |
Peak Wavelength (nm) |
Molar Extinction Coefficient (M-1cm-1) |
|---|---|---|
|
5 |
515-520 |
|
|
10 |
515-520 |
1.01 x 10⁸ |
|
15 |
520 |
3.67 x 10⁸ |
|
20 |
524 |
9.21 x 10⁸ |
|
30 |
526 |
3.36 x 10⁹ |
|
40 |
530 |
8.42 x 10⁹ |
|
50 |
535 |
1.72 x 10¹⁰ |
|
60 |
540 |
3.07 x 10¹⁰ |
|
80 |
553 |
7.70 x 10¹⁰ |
|
100 |
572 |
1.57 x 10¹¹ |
Source: http://www.sigmaaldrich.com/material....kwu2f19v.dpuf
Q4. What color would a particle that absorbs in the blue-green region of the electromagnetic spectrum appear?
Q5. What trend can be identified in the molar extinction coefficient value as particle size increases? How may this trend affect the choice of particle size in a colorimetric sensor?
In this module we will explore how experimental parameters may affect the size, size distribution and related optical properties of spherical gold nanoparticles with the goal of producing nanoparticles of consistent size with a well characterized molar extinction coefficient.