
Experimental Procedures
- Page ID
- 221609

The following procedures can be shared with students depending on the level of autonomy the instructor wishes to implement in lab. As stated at the beginning of this instructor manual, I share these procedures in the general chemistry lab since most students have not previously conducted analyses at this level. If the module is used in an upper division analytical course, students should be given the opportunity to research the methods of analysis and present a proposal to the instructor prior to its implementation.
Please keep in mind that the details of each experiment will have to be modified for the specific model of instrumentation used and for the concentration of each analyte in the samples.
Analysis of Nitrate by Ion Selective Electrode (ISE) Low-level measurement procedure
Overview
In this experiment, your team will determine, quantitatively, the amount of nitrate (NO3-) present in your water sample using a method based on a nitrate ion selective electrode.
Introduction
The nitrate ion is commonly found in natural aquatic ecosystems. Nitrates are a source of nitrogen that are essential for plant nutrients. However, too much nitrate can lead to significant water quality problems. Sources of pollution that may produce abnormally high nitrate concentrations include runoff from fertilizer and animal manure in agricultural areas, and certain industrial processes leading to production of corrosion-resistant metals. According to the EPA, the natural concentration of nitrates is typically less than 1 mg/L; however, in a polluted stream, the concentration can be as high as 30 mg/L.
Because nitrate is such a ubiquitous ion, care must be taken to handle glassware and other containers very carefully, to prevent inadvertent contamination of natural water samples with nitrates found in the lab. All glassware must be acid-washed before it comes in contact with any nitrate standard or water sample.
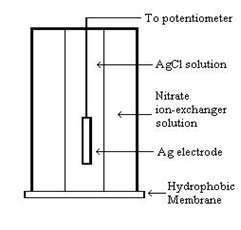
Figure 1. Schematic of a nitrate ion-selective electrode.
Because the concentration of nitrate inside the electrode chamber and in the ion-exchange membrane are different, a potential difference (voltage) is established, which can be measured with a potentiometer. The voltage depends on the concentration of nitrate in the membrane, which in turn depends on the concentration of nitrate in the water sample. Empirically, it is found that the potential difference (E) is linearly proportional to the logarithm of the concentration of nitrate in the water sample (cnitrate), according to Equation (1).
\[E = m \times \log(c_{nitrate}) + b \tag{1}\]
In this equation, m is the slope of the line, and b is the y-intercept. To determine the values of m and b, the voltages for a set of nitrate standards must first be measured. The plot of E vs. log(cnitrate) from these measurements is a calibration curve. Then, upon measuring the voltage of the water sample, we can use the calibration curve to determine the concentration of nitrate.
Unfortunately, there are many complications to the successful use of the nitrate ion-selective electrode. First, the electrode works best in a pH range between 3 and 9, but the pH must be held constant. Second, many other anions interfere with nitrate; these are nitrite, cyanide, sulfide, bromide, iodide, chlorate, perchlorate, carbonate, and bicarbonate. Of these, nitrite is the most severe, as it may be oxidized fairly easily to nitrate. If any of these ions are also present in the water sample, they might be detected as if they were nitrate, and lead to a reading that is too high. Third, many bacteria use nitrate ions as a source of food; if these bacteria are present, the concentration of nitrates will slowly decline over time, as they digest their food. Finally, nitrates can serve as an oxidizing agent; if there are organic acids around, nitrates may react with them instead of being detected by the electrode. Before analyzing your water sample, therefore, a special nitrate buffer solution must be added. This buffer solution has a pH of 3.0, and contains reagents that will diminish (but not completely eliminate) the influence of these other complications. The nitrate buffer solution contains aluminum sulfate, silver (I) sulfate, boric acid, sulfamic acid (H2NSO3H), and sodium hydroxide.
The silver (I) sulfate precipitates out any interfering bromide, iodide, sulfide or cyanide that may be present.
\[\ce{Ag+(aq) + Br- (aq) → AgBr(s)}\nonumber\]
\[\ce{Ag+(aq) + I- (aq) → AgI(s)}\nonumber\]
\[\ce{2 Ag+(aq) + S^2- (aq) →Ag2S(s)}\nonumber\]
\[\ce{Ag+(aq) + CN- (aq) → AgCN(s)}\nonumber\]
The sulfamic acid reacts with nitrite ion to produce bisulfate, nitrogen gas, and water.
\[\ce{NO2- (aq) + H2NSO3H(aq) → HSO4- (aq) + N2(g) + H2O(l)}\nonumber\]
The boric acid acts as a preservative, killing any bacteria present so that they don’t consume any more of the nitrates. Aluminum ion complexes with any organic acids present, so that they don’t react with nitrate. Finally, the sodium hydroxide is added to create a boric acid/sodium borate buffer with a final pH of 3.0. The pH is chosen to be acidic because under acidic conditions, carbonate and bicarbonate will react to form carbon dioxide gas and water. We can’t eliminate chlorate and perchlorate, but these are not normally found in natural waters anyway.
Materials and Equipment
- Water sample
- One nitrate ion-selective electrode connected to a potentiometer
- Nitrate ion-selective electrode storage solution
- 100 ppm nitrate standard solution
- Nitrate buffer solution
- 150-mL beakers
- Glass pipettes and pipette bulb
- 10% HCl solution
Procedure
NOTE: Use latex gloves when handling glassware and in all subsequent steps, for your protection and to prevent contamination of the glassware with nitrates from your hands.
The outline of the procedure is as follows:
- Acid wash all glassware.
- Prepare the nitrate calibration curve by measuring the voltage after addition of given amounts of 100 ppm nitrate standards.
- Measure the voltage of the water sample.
- Determine the concentration of nitrate using the measured voltage and the calibration curve.
Procedure for Acid Washing of Glassware
For each piece of glassware you will be using for this analysis, perform steps 1-4.
- Wash with a clean brush and phosphate-free detergent.
- Rinse three times with cold tap water.
- Rinse with a solution of 10% HCl.
- Rinse three times with deionized water.
Procedure for Preparation of the Nitrate Calibration Curve
Be sure you wear latex gloves to prevent contamination, and that you use only acid-washed glassware.
- Using a 100-mL volumetric flask, measure 100.00 mL of distilled water into 150-mL beaker. Using a pipette, add 1.00 mL low-level ISA solution and gently stir.
- Lower the nitrate ion-selective electrode into the solution, stir thoroughly, and record the voltage (in mV).
- Add increments of the 100.0 ppm standard to the beaker using steps outlined in the Table 1.
Table 1. Directions for preparing the calibration curve for nitrate analysis
|
Step |
Graduated pipet size |
Added volume (mL) |
Concentration ppm N |
|---|---|---|---|
|
1 |
1 mL |
0.1 |
0.1 |
|
2 |
1 mL |
0.1 |
0.2 |
|
3 |
1 mL |
0.2 |
0.4 |
|
4 |
1 mL |
0.2 |
0.6 |
|
5 |
1 mL |
0.4 |
1.0 |
|
6 |
2mL |
2.0 |
2.9 |
|
7 |
2mL |
2.0 |
4.7 |
- Once you have all of the data recorded in your lab notebook, using Excel or comparable program, prepare a calibration curve by plotting E (voltage), in mV, on the y-axis and log(cnitogen) on the x-axis. At high concentrations, the data should resemble a straight line, but at low concentrations the curve may bend a little bit.
- For the region on the graph that appears linear, fit the data to a straight line and record the slope and intercept in your lab notebook. Print out the calibration curve and tape it into your lab notebook.
The slope and intercept from the calibration curve depend on temperature, concentrations of certain other ions present, and other lab conditions. Thus, if you decide to measure other water samples at different times, you first should check to make sure that the calibration of the electrode is still accurate. To do this, measure the voltage of two of your standards, the 4.7 mg/L standard and the 0.4 mg/L standard. The new voltages should be within the error range of the values that were originally measured for these two standards. If they aren’t, the entire calibration curve must be shifted upwards or downwards in order to accommodate the new values.
Procedure for the Determination of the Concentration of Nitrate in the Water Sample
- Analyze water for one site in triplicate.
- Prepare your water samples by measuring 100.00 mL of sample into the 150-mL beaker. Using a pipette, add 1.00 mL low-level ISA solution and gently stir. Be sure to record any observations (e.g., precipitation, evolution of gas, temperature changes).
- Lower the nitrate electrode in the first water sample and record the voltage measured. Repeat the measurement on the two remaining samples.
- From the calibration curve previously measured, determine the concentration of nitrate in your water sample. Express the final result as the mean and standard deviation of the three replicate measurements.
Analysis of Phosphate by Visible Spectrophotometry
Overview
In this experiment, your team will determine, quantitatively, the amount of phosphate
(PO43-) present in your water sample using an ascorbic acid/spectrophotometric-based method.
Introduction
The phosphate ion is an essential plant nutrient, and is also essential to life. However, it is often depleted in soil, and hence phosphorus is the main component in most fertilizers. Runoff from fertilizer in aquatic ecosystems may thus lead to abnormally high phosphate levels, leading to a pollution hazard.
The chemistry of phosphate is much more complicated than that of most polyatomic ions. There are many different forms of phosphorus as an ion, so the simplest one, PO43-, is termed orthophosphate. The amount of orthophosphate present may be determined by the ascorbic acid/molybdenum blue method. In this method, ammonium paramolybdate, (NH4)6Mo7O24∙4H2O, reacts with orthophosphate in acidic solution and in the presence of potassium antimonyl tartrate, C8H4K2O12Sb2, to produce phosphomolybdic acid, H3[P(Mo3O10)4]. This acid, in turn, is reduced by ascorbic acid, C6H8O6, to produce intensely colored molybdenum blue. “Molybdenum blue” is actually not a single compound, but a complex mixture of polyoxomolybdate (POM) ions. The role of potassium antimonyl tartrate is as a catalyst.
\[\ce{12 Mo7O24^6- (aq) + 7 PO4^3- (aq) + 93 H+(aq) → 7 H3[P(Mo3O10)4](aq) + 36 H2O(l)}\nonumber\]
\[\ce{H3[P(Mo3O10)4](aq) + C6H8O6(aq) → “molybdenum\: blue” + C6H6O6(aq)}\nonumber\]
Once each orthophosphate sample has been converted into molybdenum blue, your team will then use UV/Visible spectrophotometry to measure the concentration of molybdenum blue. Recall that the absorbance (A) of a colored sample is directly related to the molar concentration (c) of the colored species according to Beer’s Law.
\[A = εbc \tag{1}\]
In Equation (1), ε is the molar absorptivity, characteristic of a particular species, and b is the path length of the cuvette. The molar absorptivity depends on the wavelength used; for molybdenum blue, an optimal wavelength is 880 nm. To determine ε, your team will measure the absorbances of a series of standards with known orthophosphate concentration, and construct a calibration curve between the absorbance of molybdenum blue and the concentration of orthophosphate. Then, using the calibration curve, your team will determine the amount of orthophosphate present in the water sample.
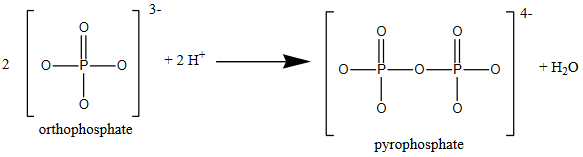
Sounds simple enough, right? If only life were so simple! Aqueous phosphorus chemistry is very diverse. Under acidic conditions, orthophosphate may react to form long chains of phosphate-like ions. The simplest of these is the reaction of two orthophosphate ions to form pyrophoshate.
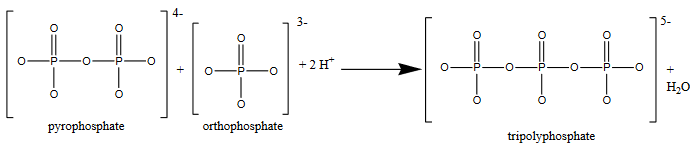
This process can be repeated to produce longer and longer phosphate-like chains. For example:
To complicate matters even more, orthophosphate can also react to form ring-like structures, such as metaphosphate.
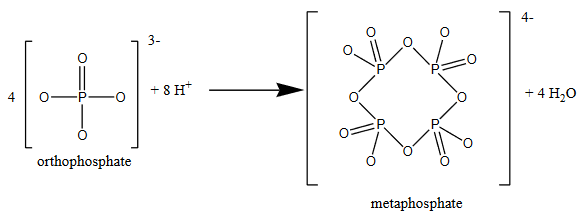
These larger chains and rings of orthophosphate-like ions don’t react with ammonium paramolybdate to form molybdenum blue, and so they won’t be detected by this method.
An additional complication arises when one considers that there are many biological processes by organisms in natural waters which can convert orthophosphate into organic forms of phosphorus, such as adenosine monophosphate (AMP). These organophosphorus compounds are unable to react with ammonium paramolybdate and form molybdenum blue, and so these as well won’t be detected by this method.
As if things weren’t bad enough, many orthophosphate compounds are insoluble, and hence remain suspended in aqueous solution. These insoluble particulates will have to be filtered out prior to analysis, and so these phosphates won’t be detected either.
Because phosphate is such a ubiquitous ion, care must be taken to handle glassware and other containers very carefully, to prevent inadvertent contamination of natural water samples with phosphates found in the lab. All glassware must be acid-washed before it comes in contact with any phosphate standard or water sample.
Materials and Equipment (provided to students)
- Water sample
- Five orthophosphate standards (expressed as mg/L P): 0.04 mg/L, 0.08 mg/L, 0.12 mg/L, 0.16 mg/L, 0.20 mg/L.
- 5 M H2SO4
- Phenolphthalein indicator solution
- Potassium antimonyl tartrate solution
- Ammonium molybdate solution (20 g ammonium paramolybdate tetrahydrate/500 mL water)
- Ascorbic acid solution (0.1 M)
- 10% HCl solution
Procedure
NOTE: Use latex gloves when handling glassware and in all subsequent steps, for your protection and to prevent contamination of the glassware with phosphates from your hands.
The outline of the procedure is as follows:
- Acid wash all glassware.
- Prepare the molybdenum blue reagent.
- For the water sample and for each of the five orthophosphate standards, perform the spectrophotometric analysis of molybdenum blue. This result will yield the amount of total dissolved reactive phosphorus.
- Using the data from the standards, construct a calibration curve relating absorbance to concentration of orthophosphate.
- From the calibration curve, determine the concentration of orthophosphate in the water sample.
Procedure for Acid Washing of Glassware
For each piece of glassware you will be using for this analysis:
- Wash with a clean brush and phosphate-free detergent.
- Rinse three times with cold tap water.
- Rinse with a solution of 10% HCl.
- Rinse three times with deionized water.
Procedure for the Preparation of the Molybdenum Blue Reagent with Ascorbic Acid
Using a graduated cylinder, measure 17.5 mL of molybdenum blue reagent w/o ascorbic acid and transfer to a beaker. Add 7.5 mL deionized water to the pre-weighed ascorbic acid (0.132 g). Mix well and add to the previously measured molybdenum blue reagent. You should have a total of 25.0 mL of reagent.
This solution is only stable for 4 hours. Thus, you must act quickly after preparing this reagent!
Procedure for Spectrophotometric Analysis of Orthophosphate
- Analyze water from one site at least in triplicate measurement.
- Prepare nine dry 50-mL Erlenmeyer flasks.
- Label one flask “blank” and using the 10.0 mL volumetric pipette, transfer 10.00 mL of deionized water.
- Label five flasks with the concentration of the five phosphate standards and pipette 10.00 mL of each standard in each designated flask.
- Label the remaining three flasks as “water sample” and transfer 10.00 mL of water from a specific site collected at Ladd Marsh.
- Add 1 drop of phenolphthalein indicator. If the solution turns pink, add 5 M H2SO4 dropwise to just discharge the color. (Make sure the eyedropper has also been acid-washed!)
- Using a pipette, add exactly60 mL of molybdenum blue reagent to every flask and mix thoroughly.
- After at least 10 minutes, but not longer than 30 minutes, measure the absorbance of the solution at 880 nm.
Once you have all of the data recorded in your lab notebook, use Excel or comparable program to prepare a calibration curve by plotting A (absorbance) on the y-axis and cP (concentration of P in mg/L) on the x-axis for the orthophosphate standard solutions. Fit the data to a straight line and record the slope and intercept in your lab notebook. Print out the calibration curve and tape it into your lab notebook.
Using the calibration curve, determine and report the concentration of phosphate in mg/L P in the water samples. Calculate the mean of the replicate measurements for each water sample and also report the standard deviation.
The slope and intercept from the calibration curve depend on temperature, concentrations of certain other ions present, and other lab conditions. Thus, if you decide to measure other water samples at different times, you first should check to make sure that the calibration curve is still accurate. To do this, measure the absorbance of two of your standards, the least concentrated standard and the most concentrated standard. The new absorbances should be within the error range of the values that were originally measured for these two standards. If they aren’t, the entire calibration curve must be shifted upwards or downwards in order to accommodate the new values.
Analysis of Calcium and Magnesium in Water Samples By Atomic Absorption Spectrophotometry
Introduction
In this experiment the amount of calcium and magnesium in water samples from the End Creek ponds will be determined using an Atomic Absorption Spectrophotometer. The results of the analysis will be reported in mg/L or parts per million (ppm) calcium, magnesium and calcium carbonate. The results will be compared to those obtained by field testing. The instrument used is Flame Atomic Absorption Spectrophotometer. Before analyzing the samples, each metal will be calibrated using a series of standards.
For a tutorial on Atomic Absorption spectroscopy, please visit http://slc.umd.umich.edu/slconline/ADVAA/AdvAA.swf
Experimental
Calcium standards. Three calcium standards are provided: 2.5 ppm, 1.25 ppm and 0.5 ppm. Use these solutions to run the calibration program, and use 0.5% nitric acid as the blank.
Magnesium standards. Three magnesium standards are provided: 2.5 ppm, 1.25 ppm and 0.5 ppm solutions. Use these solutions to run the calibration program, and use 0.5% nitric acid as the blank.
Analysis of Metals
The first part of the experiment involves becoming familiar with the operation of the instrument. It is important to understand how to change the lamp and analysis program, how to optimize the energy, ignite the flame, and run the calibration program. When running the instrument, it is critical to record the lamp energy, wavelength, slit, fuel to air ratios, and absorbance. Three different samples will be analyzed. A detailed procedure of how to operate the instrument will be provided in lab.
PROCEDURE:
The following tasks will have to be accomplished in order to perform the analysis. The order and details of operation will be specific to the instrument used.
- Load and activate the method ( a different method will have to be used for calcium and magnesium)
- Maximizing the lamp energy
- Set the correct wavelength and slit specified by the method
- Align the lamp until the energy is maximized. Most lamps will give energies in the range of 2.5 to 4.5. A normal reading for calcium is 4.2 and for magnesium is 3.2.
- Ignite the flame (acetylene and air will be used)
- Construct a calibration curve using the provided standards (this will be repeated for each metal)
- Analyze the water samples. Prepare three different water samples from the same sampling site. Aspirate the first sample being analyzed. The instrument display will show the concentration of the metal in the sample in ppm as well as the absorbance of the sample. Record the concentration in ppm. Take at least three readings for each sample. Analyze the other two samples in the same way, by aspirating the sample and taking readings. Press esc when done.
- Aspirate deionized water to clean the lines. Turn the fuel off to extinguish the flame. Run the air with DI water for a few seconds and then turn the air off.
- Analyze the same samples for the presence of other metals.
Once the samples have been analyzed for calcium and magnesium, place the rest of the samples in the proper waste container.
Using Excel or comparable program, construct a calibration curve for calcium and one for magnesium. Print each calibration curve and include in your lab notebook. Use the calibration curve to determine the concentration of each metal in each analyzed sample. Finally, report the average concentration of Ca2+, Mg2+ and total CaCO3 in mg/L with the standard deviation. Compare the concentrations obtained by AA with those obtained in the field by Hach kit.
In your report research the different levels of water hardness and determine whether the water from your sampling site can be considered soft, medium hard or hard.