
Sampling
- Page ID
- 219829

After discussing the Identifying the Problem module and the first page of the Sampling section, students can work in groups on the questions that are provided. The answers to the questions are provided below.
Q1. What key questions must be considered when designing a sampling plan?
Students should be given time to brainstorm on key issues to consider when designing a sampling plan. The instructor may want to provide the answers listed below only after the students may have had a chance to come up with their own answers. Eventually students should be guided to consider issues such as:
- Where in the ponds should we collect water samples?
- What type of samples should we collect?
- When should we collect the sample?
- What is the minimum amount of sample for each analysis?
- How many samples should we analyze?
- How can we minimize the overall variance for the analysis?
Q2. Pick eight random samples from the grid laid out below. How do you ensure you sampling is random?

One way to get random samples is to use Excel. To get 8 random grids label the boxes 1-8, row 1, 9-16, row 2, etc. for 64 boxes. Then use Excel to generate 8 random numbers between 1 and 64; for example: 63, 35, 25, 46, 7, 53, 43, 5.
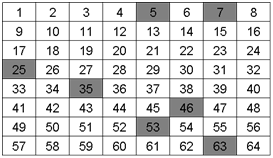
You might ask the students to discuss whether they think a random approach represents the best way to sample. They may realize that the answer depends in part on what you may already know about the system you are sampling. If there is a specific or point source of the chemical, then random sampling might not be the best option.
Now take a look at the following grids with the analyte of interest identified (colored squares).
|
1 |
2 |
3 |
4 |
5 |
6 |
7 |
8 |
|
|
1 |
||||||||
|
2 |
||||||||
|
3 |
||||||||
|
4 |
||||||||
|
5 |
||||||||
|
6 |
||||||||
|
7 |
||||||||
|
8 |
Grid A
|
1 |
2 |
3 |
4 |
5 |
6 |
7 |
8 |
|
|
1 |
||||||||
|
2 |
||||||||
|
3 |
||||||||
|
4 |
||||||||
|
5 |
||||||||
|
6 |
||||||||
|
7 |
||||||||
|
8 |
Grid B
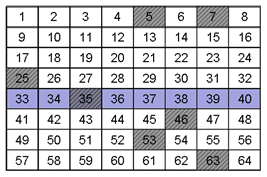
Q3. Would you consider the samples above to be heterogeneous or homogeneous?
The analyte is heterogeneous because it is not evenly distributed throughout the entire grid.
Q4. Did your random sampling affect the potential accuracy or precision of your measurement of the analyte for the samples in grid A or grid B? If so how?
The random sampling would have been better for grid B because the analyte is more spread out than in grid A where the analyte is confined or stratified.
Q5. Each of the previous grids is an example of one of these cases. Can you identify which sample is which?
Sample B exhibits constitutional heterogeneity while Sample A exhibits distributional heterogeneity.
Q6. How does distribution heterogeneity affect accuracy and precision?
The answer to Q6 is included with the answer to Q7 below.
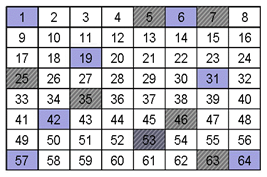
Q7. How does constitutional heterogeneity affect accuracy and precision?
When you overlay the sampling scheme with Sample A and Sample B neither sampling scheme is effective, as shown below. The analyte in sample “A” was sampled once (35) as it was in Sample “B” (53).With either sample, unless the sampling scheme could take this heterogeneity into account, the accuracy and precision of the measurement would be compromised.
A. Distributional Heterogeneity
B. Constitutional Heterogeneity
Q8. Do you see a scenario where distribution heterogeneity could be magnified by mixing and/or sampling?
Sampling is often by weight or by “grab”. In this case settling may alter the sample composition.
Q9. What is the advantage of implementing judgmental sampling over random sampling if one knows the point source for the discharge an analyte into a system?
The advantage is that you can get larger number of relevant samples which should decrease the standard deviation of the average value measured for that sample. The cost should also decrease.
Q10. Assume you have chosen a selective sampling plan to evaluate pollution from a point source into a pond. Use the diagram below and words to describe your sampling plan.
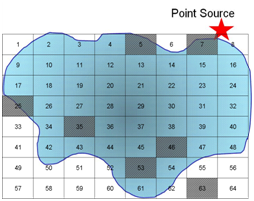
If we use a purely random grid over the pond we will be unable to tell what the effect of the point source is because we would have sampled only once at the source.
A selective method might be the following:
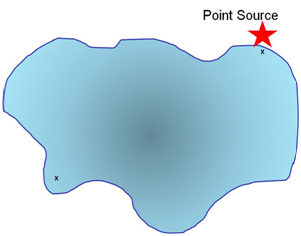
A sample is taken at the point source and for comparison a sample is taken at a distance from the point source.
Q11. Use a grid design (as we have previously done) to show how you would conduct systematic sampling (regular intervals in space and time) of the pollutant. Is there an advantage to what you might learn using this sampling method? What are the disadvantage(s)?
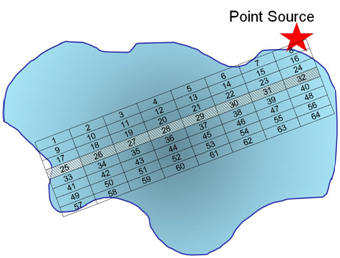
Here we have set up a grid along regular intervals. Because we collect only 8 samples, we may or may not collect a representative sample from within each grid point as we are only collecting one sample.
Q12. Describe how stratified sampling (random sampling within sub populations) might be applied to evaluate the pollutant in the lake? In general, what is the advantage of stratified sampling over cluster sampling?
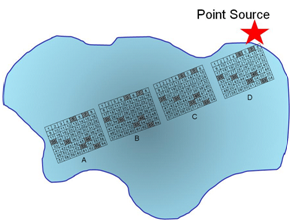
In this example the trajectory along the longest distance from the point source is sampled a total of four times, with random grabs to be co-joined into a single sample.
Q13. What is the main disadvantage of grab and composite samples?
You cannot use them continuously for real time in situ monitoring.
Q14. Can you think of any control studies you might want to include when compositing samples?
You might want to retain portions of the grabs and analyze them separately.
Q15. Does the EPA Volunteer Stream Monitoring web site suggest a particular sampling method?
The EPA Volunteer Stream Monitoring web site does not describe a particular sampling method because each sampling plan must be designed for the specific analytical question being addressed.
Q16. Based on the graph above, describe a sampling procedure that would allow you to obtain a representative sample.
A strategy would be to collect multiple samples at regular intervals of time during a 24-hour span of time.
Q17. Is there any systematic pattern to the data in the graph above?
There is not a systematic pattern although spikes in pH appear more prominent in late fall and winter and early summer months.
Q18. Can you think of some event(s) that may account for the acidic spikes in the pH?
Spikes may be due to acidic snow or rain fall.
Q19. How would this pH data affect when you might choose to sample a site to assess if acid rain is impacting the ecosystem?
Sampling would have to be conducted at regular intervals to account for known fluctuations. If historical data are available, they may aid in better understanding the impact of any changes in pH.
Q20. Describe what else you would need to know to determine when to perform your sample collection if you are addressing whether acid rain is impacting a site. What other data might you need to look up or consider that would contribute to the changes in pH? Would this data affect when you choose to sample?
One consideration is the natural pH functions due to changes in CO2. In the early morning CO2 levels tends to be higher due to respiration that occurs during night time. As sun rises, plants and algae begin photosynthesis thereby consuming CO2 and causing the pH to rise (more basic) as the day progresses. Algae blooms can significantly increase this effect.
Q21. What physical or chemical processes might contribute to the pH fluctuations? How might this affect your sampling plan?
As stated above, CO2 functions may affect pH. Water temperature affects solubility of gasses, thus changing the amount of CO2 dissolved in water.
Q22. Another factor to consider is the sample handling time. Can you think of ways in which the sampling handling time may impact the concentration of species in a sample?
Some analytes may precipitate or degrade over time if the sample is not properly handled. For example, calcium and magnesium tend to precipitate as hydroxides. Therefore, sample pH will have to be adjusted below 2 if the analysis is not conducted right away. Nitrates are quickly degraded by bacteria, so concentration of nitrates may change over time if the sample is not refrigerated.
Q23. It is known from analyses conducted in 2008 that the % relative sampling error for water hardness by EDTA titration is 0.8%. How many samples should you collect to limit the relative standard deviation for sampling to 1.0% within the 95% confidence level? Is this a feasible task?
Answering this question requires reading Harvey, specifically section 7.2: How Many Samples to Collect.
The minimum number of samples can be calculated using the equation:
\[n_\textrm{samp} = \dfrac{t^2s^2_\textrm{samp}}{e^2}\nonumber\]
where t is the value for the t test which depends on the confidence level, ssamp is the relative standard deviation for sampling, and e is the percent relative sampling error.
Because the value of t depends on nsamp, the solution is found iteratively. We start for a value of n = ∞ and t (0.05, ∞) = 1.960.
\[n_\textrm{samp} = \dfrac{(1.960)^2(1.0)^2 }{(0.8)^2} = 6.0\nonumber\]
Letting nsamp = 6, t (0.05, 6) = 2.447
\[n_\textrm{samp} = \dfrac{(2.447)^2(1.0)^2}{(0.8)^2}= 9\nonumber\]
Letting nsamp = 9, t (0.05, 9) = 2.262
\[n_\textrm{samp} = \dfrac{(2.262)^2(1.0)^2} {(0.8)^2}= 8\nonumber\]
Letting nsamp = 8, t (0.05, 8) = 2.306
\[n_\textrm{samp} = \dfrac{(2.306)^2(1.0)^2}{(0.8)^2}= 8\nonumber\]
Because two successive calculations give the same value for ssamp, we have an iterative solution to the problem. We need at least 8 samples to achieve a percent relative sampling error of ±0.80% at the 95% confidence level.
Q24. If the cost of collecting a sample is $20 and the cost of analyzing a sample is $50 what budget should you allocate for the project and what sampling strategy would be most effective for the given number of samples?
If we have 8 samples, the cost of collecting will be $160 and cost of analysis $400, for a total of $560. Most effective sampling plan would be judgmental.
Q25. Below is a picture of one of the three ponds at End Creek. Design your sampling plan. Think about random, systematic, clustering, etc. sample strategies. Will you take grab samples or pool samples together?
One way to use this question is to have the students discuss these questions in groups and put together a final plan. The plans could either be presented to the class or turned in as a graded written assignment.
The last part of this module discusses proper preparation of sampling containers. The procedures included within this guide adhere to EPA guidelines for water monitoring.
Q26. Why are different procedures recommended? For which analytes is acid washing required and why? What is the purpose of using a phosphate-free detergent?
To answer this question, students may be directed to the EPA Monitoring and Assessing Water Quality website (http://water.epa.gov/type/rsl/monitoring/vms50.cfm). Acid washing is required for nitrate and phosphate analyses. Obviously, phosphate-free detergent is necessary to eliminate any possible contributions of phosphate that may have adhered to the container during washing. Acid washing will remove any traces of nitrates or phosphates from containers.
Q27. For some analytes such as phosphorous, plastic containers made of either high-density polyethylene or polypropylene might be preferable to glass. Why would this be the case? In addition, the EPA states that all containers and glassware must be “dedicated” to a specific analysis. What would be the drawback of reusing glassware for a different analysis?
Glass and some types of plastic containers have positive ion-exchange sites that can interact with negative ions in solution. Phosphate can therefore adhere to the surface of glass and be lost. Phosphorous is also known to leach out of glass containers. Rinsing containers with dilute HCl helps saturate the sites and minimize losses due to adsorption.
Since most of the analyses are performed at trace level, dedicated containers should be used to avoid cross contamination.