
Sampling
- Page ID
- 218451

Designing a sampling plan for End Creek ponds
Purpose: The purpose of this assignment is to address questions related to designing a sampling plan for surface waters [i.e. ponds, lakes, rivers and streams] where several water quality parameters will be tested. The following example describes the specific case of sampling ponds such as those found on the End Creek Wetland restoration site. While different approaches may be necessary depending on whether water will be collected from a stream, lake, or natural spring, the fundamental steps described in this document should find broad application in the design of any sampling plan.
Learning Outcomes:
At the end of this assignment you will be able to
- Define various sampling strategies
- Assess the benefits and limitations of different sampling strategies
- Determine an appropriate sampling plan for analysis of surface waters
Assignment:
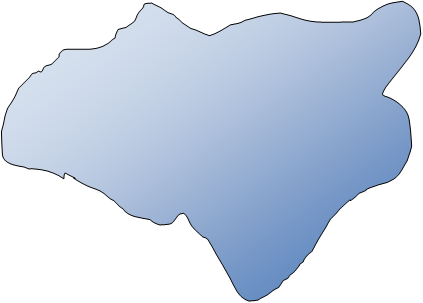
An important aspect of designing an experiment is collecting a representative sample. What is a representative sample? That is often a difficult question to answer. In the context of an analytical chemistry measurement, representative means that the concentration of the analyte in the sample analyzed is a good representation of its levels in the material or system being tested. If sampling is not done correctly it could be the “weak link” in an analysis, leading to inaccurate results. Often, sampling can be a source of error that is overlooked. Below is an actual map of the End Creek wetland. We will focus our sampling efforts specifically on the North, South and East ponds.

DESIGNING A SAMPLING PLAN
Q1. What key questions must be considered when designing a sampling plan?
Where to Sample?
How do you obtain a representative sample? One approach is to take a grab sample. Consider a solid sample divided out as a grid, below. How do you choose where to grab from? One approach is to choose randomly.
Q2. Pick eight random samples from the grid laid out below. How do you ensure your sampling is random?
Suppose that our analyte of interest (colored squares) was distributed across the sample in the manner shown below.
|
1 |
2 |
3 |
4 |
5 |
6 |
7 |
8 |
|
|
1 |
||||||||
|
2 |
||||||||
|
3 |
||||||||
|
4 |
||||||||
|
5 |
||||||||
|
6 |
||||||||
|
7 |
||||||||
|
8 |
Grid A
|
1 |
2 |
3 |
4 |
5 |
6 |
7 |
8 |
|
|
1 |
||||||||
|
2 |
||||||||
|
3 |
||||||||
|
4 |
||||||||
|
5 |
||||||||
|
6 |
||||||||
|
7 |
||||||||
|
8 |
Grid B
Q3. Would you consider the samples above to be heterogeneous or homogeneous?
Q4. Did your random sampling affect the potential accuracy or precision of your measurement of the analyte concentration for the samples in grid A or grid B? If so how?
Although we would like to assume that a sample is homogenous it is often not the case. When trying to obtain a representative sample from a heterogeneous material or system, you need to consider both distributional and constitutional heterogeneity.
Distribution heterogeneity is caused by segregation of the sample (i.e. settling).
Constitutional heterogeneity is a fundamental property of a material and is caused by differences in particle size and/or composition.
Q5. Each of the previous grids is an example of one of these cases. Can you identify which sample shows distributional heterogeneity and which shows constitutional heterogeneity?
Q6. How does distribution heterogeneity affect accuracy and precision?
Q7. How does constitutional heterogeneity affect accuracy and precision?
Q8. Do you see a scenario where distribution heterogeneity could be magnified by mixing and/or sampling?
If samples are mixed well, distributional heterogeneity is insignificant and only constitutional heterogeneity is present. It is important to note, however, that the analyte’s spatial or temporal distribution might also be of importance in the analysis and mixing may not always be the best choice.
Types of Sampling Plans:
What we have highlighted above is an example of random sampling, which is often applied to a grid design. Random sampling strategies can be applied to any target population (i.e. evaluating a solid sample or measuring water quality parameters at End Creek). However, random sampling can at times be expensive and is not necessarily cost effective, as you often need a greater number of samples to ensure that your samples represent the body of water. If you know something about the body of water under study, other sampling methods may be possible or appropriate. Here are a few examples.
Selective (Judgmental) Sampling – this is at the opposite extreme of random sampling, and is done if you have prior information about the target. For example, if you wanted to evaluate the metal content in pennies you might exclude from your study coins that are corroded or select coins from a specific mint date.
Ease of Access Sampling – Many times on ponds, rivers, or streams the ultimate sampling site selected is a location where access is available. This can be acceptable as long as the sampling site allows the initial question to be answered. When considering the location, one needs to consider safety during access and whether the land is public or private.
Systematic Sampling – Sampling the target population at regular intervals in space or time. This approach is often considered to fall between the extremes of random and selective sampling.
Stratified Sampling – The population may be divided into sub populations (groups) that are distinctly different (this might be size of sample, type of sample, depth of sample). Then, the overall sampling within the groups is randomly conducted and the samples are pooled.
Cluster Sampling – is a sampling technique where the population is divided into groups or clusters and random samples are selected from the cluster for analysis. The main objective of cluster sampling is to reduce costs by increasing sampling efficiency.
Q9. What is the advantage of implementing a judgmental sampling scheme over random sampling if one knows the point source for the discharge an analyte into a system?
Q10. Assume you have chosen a selective sampling plan to evaluate pollution from a point source into a pond. Use the diagram below and words to describe your sampling plan.

Q11. Use a grid design (as we have previously done) to show how you would conduct systematic sampling of the pond to measure levels of the pollutant. Is there an advantage to what you might learn using this sampling method? What are the disadvantage(s)?
Q12. Describe how stratified sampling might be applied to evaluate the pollutant in the lake? In general, what is the advantage of stratified sampling over cluster sampling?
What Type of Sample to Collect?
When implementing a sample plan often grab samples are used. In some cases composite sampling (combining a set of grab samples into one sample) is more useful. This strategy may be used if:
There is interest in the target population’s average composition over time in space.
A single sample does not supply sufficient material for analysis.
Q13. What is the main disadvantage of grab and composite samples?
Q14. Can you think of any control studies you might want to do, when compositing samples?
Q15. Does the EPA Volunteer Stream Monitoring web site suggest a particular sampling method?
Consider the natural fluctuation of dissolved oxygen in a lake over time that is shown in the graph below.
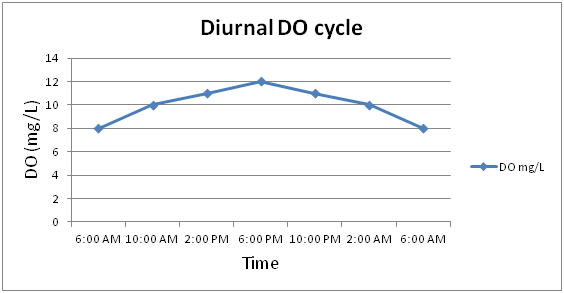
Q16. Based on the graph above, describe a sampling procedure that would allow you to obtain a representative sample.
Another variable that can fluctuate in natural water is the pH. The graph below shows pH data continuously recorded in a river over an entire year.
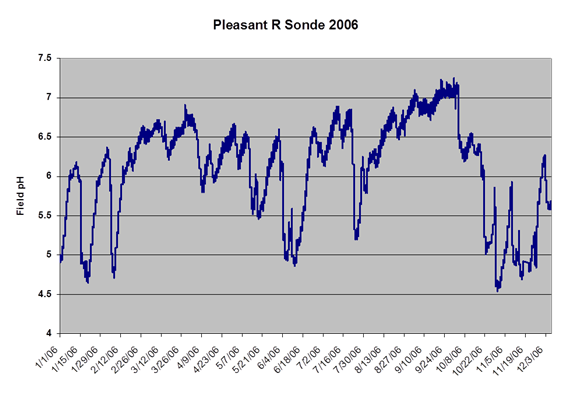
Q17. Is there any systematic pattern to the data in the graph above?
Q18. Can you think of some event(s) that may account for the acidic spikes in the pH?
Q19. How would this pH data affect when you might choose to sample a site to assess if acid rain is impacting the ecosystem?
Q20. Describe what else you would need to know to determine when to perform sample collection if you are addressing whether acid rain is impacting a site. What other physical or chemical parameters might you need to consider that could contribute to changes in pH? Is it really the "data" that would affect when you would choose to sample?
Data in the previous graph covered an entire year. The following data was collected every fifteen minutes over a 3 day period.
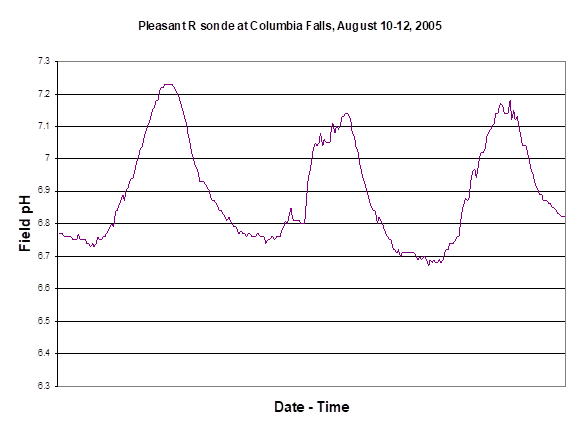
pH measured every 15 minutes over a period of three days starting at midnight.
Q21. What physical or chemical processes might contribute to the pH fluctuations? How might this variation affect your sampling plan?
Q22. Another factor to consider is the sample handling time. Can you think of ways in which the sampling handling time may impact the concentration of species in a sample?
Minimizing Variance - What is the Minimum Amount of Sample? How Many Samples are Needed?
When sampling you want to make sure the sample is not too small, so that the composition is not substantially different from the typical composition of the body of water. You also want to ensure that you collect an appropriate number of samples for analysis.
The variance of the (1) analysis method and (2) sampling approach both contribute to the variance in a given analysis. Sampling variance can be improved by collecting more samples of the proper size. Increasing the number of times a given sample is analyzed improves the method’s variance.
Q23. It is known from analyses conducted in 2008 that the % relative sampling error for water hardness by EDTA titration is 0.8%. How many samples should you collect to limit the relative standard deviation for sampling to 1.0% within the 95% confidence level*? Is this a feasible task?
Q24. If the cost of collecting a sample is $20 and the cost of analyzing a sample is $50 what budget should you allocate for the project and what sampling strategy would be most effective for the given number of samples?
For further discussion on sampling amounts see section 7.2 in Harvey, D. Chapter 7, Collecting and Preparing Samples.
*For a review of confidence levels see section 4.4 in Harvey, D. Chapter 4, Evaluating Analytical Data.
Design Your Sampling Plan
Of course we would like to collect as many samples as possible to minimize our variance. However, in every lab there are limitations such as those above related to cost per-sample collected and cost-per analysis.
How do we go about collecting samples?
Equipment and sampling procedures are typically specific to the specific water quality parameter one wishes to determine. However, there are two fundamental tasks that are common to any water analysis: the preparation of the sampling containers and the sample collection.
Preparation of sampling containers.
For some analyses the EPA recommends to:
- Wear latex gloves.
- Wash each sample bottle or piece of glassware with a brush and phosphate-free detergent.
- Rinse three times with cold tap water.
- Rinse three times with distilled or deionized water.
For other analyses the EPA recommends to:
- Wear latex gloves.
- Wash each sample bottle or piece of glassware with a brush and phosphate-free detergent.
- Rinse three times with cold tap water.
- Rinse with 10 percent hydrochloric acid.
- Rinse three times with deionized water.
Q26. Why are different procedures recommended? For which analytes is acid washing required and why? What is the purpose of using a phosphate-free detergent?
Q27. For some analytes such as phosphorous, plastic containers made of either high-density polyethylene or polypropylene might be preferable to glass. Why would this be the case? In addition, the EPA states that all containers and glassware must be “dedicated” to a specific analysis. What would be the drawback of reusing glassware for a different analysis?
Sample collection.
The EPA recommends two procedures for water collection, either using disposable whirl-pak bags or screw cap bottles. The following are excerpts from the EPA Monitoring and Assessing Water Quality website (http://water.epa.gov/type/rsl/monitoring/vms50.cfm).
“For Whirl-pak® Bags
- Label the bag with the site number, date, and time.
- Tear off the top of the bag along the perforation above the wire tab just prior to sampling . Avoid touching the inside of the bag. If you accidentally touch the inside of the bag, use another one.
- Wading. Try to disturb as little bottom sediment as possible. In any case, be careful not to collect water that contains bottom sediment. Stand facing upstream. Collect the water sample in front of you.
Boat. Carefully reach over the side and collect the water sample on the upstream side of the boat. - Hold the two white pull tabs in each hand and lower the bag into the water on your upstream side with the opening facing upstream. Open the bag midway between the surface and the bottom by pulling the white pull tabs. The bag should begin to fill with water. You may need to "scoop" water into the bag by drawing it through the water upstream and away from you. Fill the bag no more than 3/4 full!
- Lift the bag out of the water. Pour out excess water. Pull on the wire tabs to close the bag. Continue holding the wire tabs and flip the bag over at least 4-5 times quickly to seal the bag. Don't try to squeeze the air out of the top of the bag. Fold the ends of the wire tabs together at the top of the bag, being careful not to puncture the bag. Twist them together, forming a loop.
- Fill in the bag number and/or site number on the appropriate field data sheet. This is important! It is the only way you will know which bag goes with which site.
- If samples are to be analyzed in a lab, place the sample in the cooler with ice or cold packs. Take all samples to the lab.
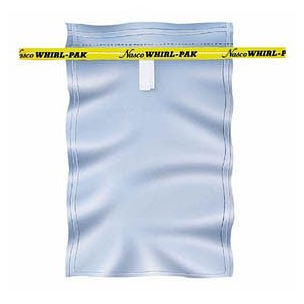
Whirl-pak® bag
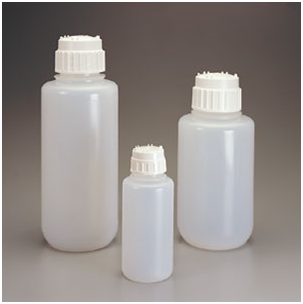
For screw-cap bottles
- Remove the cap from the bottle just before sampling. Avoid touching the inside of the bottle or the cap. If you accidentally touch the inside of the bottle, use another one.
- Wading. Try to disturb as little bottom sediment as possible. In any case, be careful not to collect water that has sediment from bottom disturbance. Stand facing upstream. Collect the water sample on your upstream side, in front of you. You may also tape your bottle to an extension pole to sample from deeper water.
Boat. Carefully reach over the side and collect the water sample on the upstream side of the boat. - Hold the bottle near its base and plunge it (opening downward) below the water surface. If you are using an extension pole, remove the cap, turn the bottle upside down, and plunge it into the water, facing upstream. Collect a water sample 8 to 12 inches beneath the surface or mid-way between the surface and the bottom if the stream reach is shallow.
- Turn the bottle underwater into the current and away from you. In slow-moving stream reaches, push the bottle underneath the surface and away from you in an upstream direction.
- Leave a 1-inch air space (Except for DO and BOD samples). Do not fill the bottle completely (so that the sample can be shaken just before analysis). Recap the bottle carefully, remembering not to touch the inside.
- Fill in the bottle number and/or site number on the appropriate field data sheet. This is important because you will know which bottle goes with which site.
- If the samples are to be analyzed in the lab, place them in the cooler for transport to the lab.”
For further discussion on designing and implementing a sampling plan see sections 7.2 and 7.3 in Harvey, D. Chapter 7, Collecting and Preparing Samples.