
Sampling and Sample Preparation
- Page ID
- 222333

Designing a Sampling Plan for Water Analysis
Purpose: The purpose of this module is to design a sampling plan for surface waters [i.e. ponds, lakes, rivers and streams]. Different approaches may be necessary depending on whether water will be collected from a stream, lake, or other sources of water, but the underlying steps should find broad application in the design of any sampling plan. This module does specifically use the scenario of the Atlantic Salmon survival in acid impaired streams, but is easily applied to other scenarios where surface water analysis is important.
Learning Outcomes:
At the end of this assignment you will be able to
- Define various sampling strategies
- Assess the benefits and limitations of different sampling strategies
- Determine an appropriate sampling plan for the analysis of surface waters
Assignment:
An important aspect of designing an experiment is collecting a representative sample, but defining a representative sample can be a difficult problem to answer. In the context of an analytical chemistry measurement, representative means that the concentration of the analyte in the sample analyzed is a good representation of its levels in the material or system being tested. If sampling is not done correctly it could be the “weak link” in an analysis, leading to inaccurate results. Often, sampling can be a source of error that is overlooked.
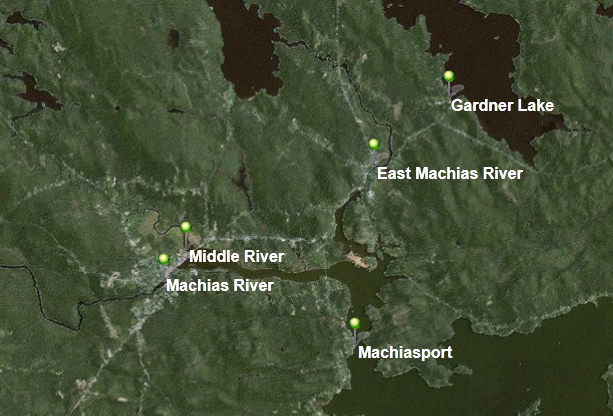
Below is a map of the confluence of the East Machias and Machias rivers, two rivers systems with genetically distinct Atlantic Salmon populations. There are multiple lakes, rivers, and even ponds in this area that salmon migrate through. The design of the sampling plan will focus on the breadth of surface water sources, and is easily adaptable to almost any body of surface water.
Q1. Identify the key questions that must be considered when designing a sampling plan to obtain a representative sample.
Where to Sample?
How do you obtain a representative sample? One approach is to take a grab sample. Consider a solid sample divided out as a grid, below. How do you choose where to grab from? One approach is to choose randomly.
Q2. Pick eight random samples from the grid laid out below. How do you ensure your sampling is random?
Now take a look at the following samples divided into grids with the analyte of interest identified (colored squares).
Q3. Would you consider the samples above to be heterogeneous or homogeneous?
Q4. Did your random sampling affect the potential accuracy or precision of your measurement of the analyte for the samples in grid A or grid B? If so how?
Although we would like to assume that a sample is homogenous it is often not. When trying to sample a heterogeneous sample, you need to consider both distributional and constitutional heterogeneity.
Distribution heterogeneity is caused by segregation of the sample (i.e. settling).
Constitutional heterogeneity is a fundamental property of a material and is caused by differences in particle size and/or composition.
Q5. Each of the previous grids is an example of one of these cases. Can you identify which sample is which?
Q6. How does distribution heterogeneity affect accuracy and precision?
Q7. How does constitutional heterogeneity affect accuracy and precision?
Q8. Do you see a scenario where distribution heterogeneity could be magnified by mixing and/or sampling?
If samples are mixed well, distributional heterogeneity is insignificant and only constitutional heterogeneity is present. It is important to note, however, that the spatial or temporal distribution of an analyte might also be important in the analysis and mixing may not always be the best choice.
Types of Sampling Plans:
What we have highlighted above is an example of random sampling, which is often applied to a grid design as shown above. Random sampling strategies can be applied to any target population (i.e. evaluating a solid sample or measuring water quality parameters within a creek). However, random sampling can at times be expensive and not necessarily cost effective, as you often need a greater number of samples to ensure that your samples represent the target population. If you know something about the target population, other sampling methods may be possible or appropriate. Here are a few examples.
Selective (Judgmental) Sampling - this is at the opposite extreme of random sampling, and is done if you have prior information about the target. For example, if you wanted to evaluate the metal content in pennies you may not select coins that are corroded or choose coins from a specific mint date.
Ease of Access Sampling - Many times on ponds, rivers, or streams the ultimate sampling site is based on being able to access the point, as long as this sampling site allows the initial question to be answered. When considering the location, one needs to consider safety during access and whether the land is public or private.
Systematic Sampling - Sampling the target population at regular intervals in space or time. This is often considered to fall between the extremes of random and selective sampling.
Stratified Sampling – The population may be divided into sub populations (groups) that are distinctly different (this might be size of sample, type of sample, depth of sample). Then, the overall sampling within the groups is randomly conducted and the samples are pooled.
Cluster Sampling- is a sampling technique where the population is divided into groups or clusters and random samples are selected from the cluster for analysis. The main objective of cluster sampling is to reduce costs by increasing sampling efficiency.
Q9. What is the advantage of implementing a judgmental sampling scheme over random sampling if one knows the point source for the discharge an analyte into a system?
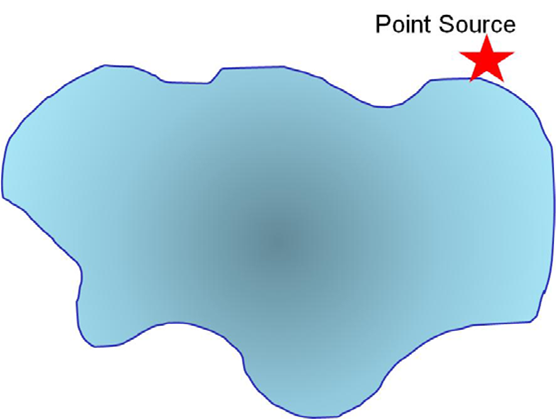
Q10. Assume you have a chosen a selective sampling plan to evaluate pollution from a point source into a pond. Use the diagram below and words to describe your sampling plan.
Q11. Use a grid design (as we have previously done) to show how you would conduct systematic sampling of the pollutant. Is there an advantage to what you might learn using this sampling method? What are the disadvantage(s)?
Q12. Describe how stratified sampling might be applied to evaluate the pollutant in the lake? In general, what is the advantage of stratified sampling over cluster sampling?
What Type of Sample to Collect?
When implementing a sample plan often grab samples are used. In some cases composite sampling (combining a set of grab samples into one sample) is more useful. This strategy may be used if there is interest in the target population’s average composition over time in space or a single sample does not supply sufficient material for analysis.
Q13. What is the main disadvantage of grab and composite samples?
Q14. Can you think of any control studies you might want to do when compositing samples?
Q15. If you are beginning to monitor a site or want to compare your data to a similar source, have there been any standard sampling protocols used for prior monitoring?
Another factor that can affect your sampling plan is whether the analyte of interest varies temporally. So you should think about whether there will there be any chemical changes over time that would impact your sampling plan.
Consider the fluctuation of dissolved oxygen over time in a lake as shown in the graph below.
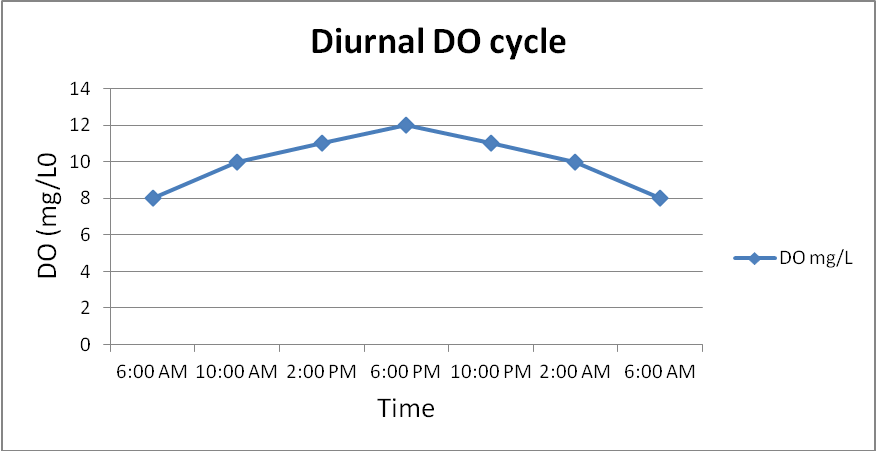
Q16. Based on the graph above, describe a sampling procedure that would allow you to obtain a representative sample?
Another variable that can fluctuate in natural water is the pH. The graph below shows pH data continuously collected for a Maine river site over an entire year.
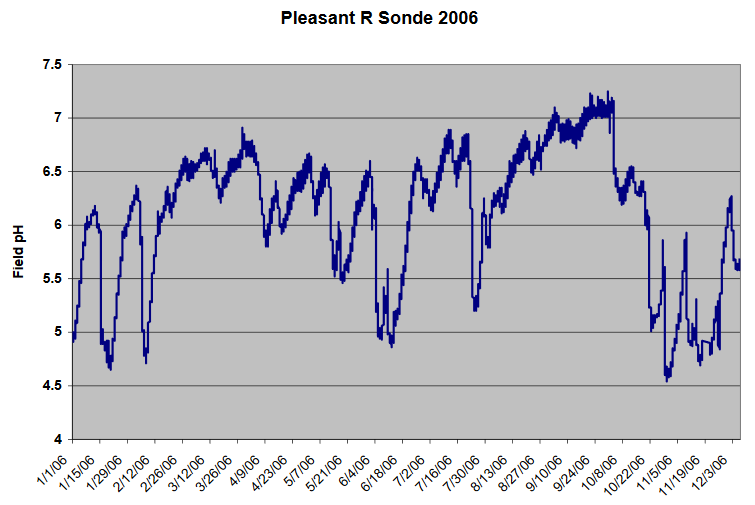
Q17. Is there any systematic pattern to the data in the graph above?
Q18. Can you think of some event(s) that may account for the acidic spikes in the pH?
Q19. How would this data impact when you might choose to sample a site to assess if acid rain is having an impact on the ecosystem?
Q20. Describe what else you would need to know to determine when to perform your sample collection if you are addressing whether acid rain is impacting a site. What other data might you need to look up or consider that would contribute to the changes in pH? Would this data affect when you choose to sample?
Data in the previous graph covered an entire year. The following data was collected every minutes over a 3 day period.

pH measured every 15 minutes over a period of three days starting at midnight.
Q21. What physical or chemical processes might contribute to the pH fluctuations? How might this affect your sampling plan?
Q22. Another factor to consider in a sampling plan is the sample holding time. Can you think of ways in which sample holding time may impact the concentration of different species such as nitrate, pH, and Ca2+ in the sample?
The guidelines on preservation methods and holding time for some common analytes are listed below.
|
Analyte |
Preservation Method |
Maximum Holding Time |
|---|---|---|
|
Ammonia |
cool to 4 oC; add H2SO4 to pH < 2 |
28 days |
|
Chloride |
none required |
28 days |
|
metals—Cr(VI) |
cool to 4 oC |
24 hours |
|
metals—Hg |
HNO3 to pH < 2 |
28 days |
|
metals—all others |
HNO3 to pH < 2 |
6 months |
|
Phosphate |
Cool to 4 oC |
48 hours |
|
Nitrate |
Cool to 4 oC |
48 hours |
|
pH |
none required |
analyze immediately |
Q23. Why would adjusting the solution pH to below pH 2.0 be needed for preserving samples for metal analysis? How can the solution be adjusted to pH 2 without significantly diluting the sample?
Minimizing Variance - What is the Minimum Amount of Sample? How Many Samples are Needed?
When sampling, you need to make sure the sample is not too small, so that the composition is not substantially different from the target population. You also want to ensure that you collect an appropriate number of samples for analysis.
The variance of the (1) analysis method and (2) sampling approach both contribute to the variance in a given analysis. Sampling variance can be improved by collecting more samples of the proper size. Increasing the number of times a sample is analyzed improves the method’s variance.
Q24. It is known from analyses conducted in 2008 that the % relative sampling error for water hardness by EDTA titration is 0.8%. How many samples should you collect to limit the relative standard deviation for sampling to 1.0% within the 95% confidence level? Is this a feasible task? (May help by referring to the Analytical Chemistry 2.0 by David Harvey section 7.2: How Many Samples to Collect, http://collection.asdlib.org/?p=452)
Q25. Based on your results from the prior question, if the cost of collecting a sample is $25 and the cost of analyzing a sample is $50 what budget should you allocate for the project and what sampling strategy would be most effective for the given number of samples?
Design Your Sampling Plan
Of course we would like to collect as many samples as possible to minimize our variance. However, in every lab there are limitations such as those above related to cost per-sample collected and cost-per analysis.
Q26. Using the map from the beginning of this module that has the area around Machias, where the confluence of the Machias, Middle, and East Machias Rivers empty into the Machias Bay. Design your sampling plan. Think about random, systematic, clustering, etc. sample strategies. Will you take grab samples or pool samples together?
Protocols associated with actually collecting samples
Equipment and sampling procedures are typically specific to the specific water quality parameter one wishes to determine. However, there are two fundamental tasks that are common to any water analysis: the preparation of the sampling containers and the sample collection.
Preparation of sampling containers.
For some analyses the EPA recommends (see the EPA Monitoring and Assessing Water Quality website (http://water.epa.gov/type/rsl/monitoring/vms50.cfm) to:
- Wear latex gloves.
- Wash each sample bottle or piece of glassware with a brush and phosphate-free detergent.
- Rinse three times with cold tap water.
- Rinse three times with distilled or deionized water.
For other analyses the EPA recommends to:
- Wear latex gloves.
- Wash each sample bottle or piece of glassware with a brush and phosphate-free detergent.
- Rinse three times with cold tap water.
- Rinse with 10 percent hydrochloric acid.
- Rinse three times with deionized water.
Q27. Why are different procedures recommended? Why do you think acid washing of the glassware is recommended for some analyses? What is the purpose of using a phosphate-free detergent?
Q28. For some analytes such as sodium, plastic containers made of either high-density polyethylene or polypropylene might be preferable to glass. Why would this be the case? In addition, the EPA states that all containers and glassware must be “dedicated” to a specific analysis. What would be the drawback of reusing glassware for a different analysis?