
Part VI. Finding the Global Optimum Across All Analytes
- Page ID
- 240552

To explore the effect of s on individual desirability, calculate di for responses from 0.0 to 1.0, in steps of 0.1, using an upper limit of 0.75 and a lower limit of 0.25, and values of 0.5, 1.0, and 5.0 for s. Examine your results and comment on any trends you see.
The table and figure below summarize the individual desirability for each response at each value of s.
|
response |
di (s = 0.5) |
di (s = 1) |
di (s = 5) |
|---|---|---|---|
|
0.0 |
0.000 |
0.000 |
0.000 |
|
0.1 |
0.000 |
0.000 |
0.000 |
|
0.2 |
0.000 |
0.000 |
0.000 |
|
0.3 |
0.316 |
0.100 |
0.000 |
|
0.4 |
0.548 |
0.300 |
0.002 |
|
0.5 |
0.707 |
0.500 |
0.031 |
|
0.6 |
0.837 |
0.600 |
0.168 |
|
0.7 |
0.949 |
0.700 |
0.590 |
|
0.8 |
1.000 |
1.000 |
1.000 |
|
0.9 |
1.000 |
1.000 |
1.000 |
|
1.0 |
1.000 |
1.000 |
1.000 |
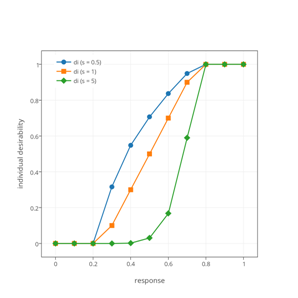
When s = 1 there is a linear relationship between Ri and di for responses between the lower limit and the upper limit. For smaller values of s, the individual desirability increases more quickly than the response, and for larger values of s, the individual desirability increases more slowly than the response. Choosing a value of s greater than 1.0 delays the increase in the individual desirability, giving more weight to those responses closer to the lower limit; choosing a value of s less than 1.0 accelerates the increase in individual desirability, giving more weight to those responses closer to the upper limit.
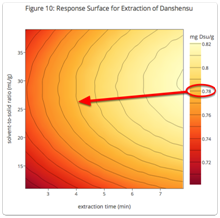
Compare the response surface for danshensu’s individual desirability (Figure 16) to its response surface in terms of extraction yield (Figure 10). In what ways are these response surfaces similar and in what ways are they different?
The two response surfaces are similar in showing how a change in extraction time affects the extraction yield, with longer extraction times resulting in greater extraction yields. Both response surfaces show that the extraction yield increases as the solvent-to-solid ratio increases from its lower limit, although the response surface for danshensu’s individual desirability does not show a decrease in the extraction yield for larger solvent-to-solid ratios. The response surface for danshensu’s individual desirability, with its large plateau, shows more clearly that the optimum condition for extracting danshensu is relatively insensitive to a change in the extraction time and the solvent-to-solid ratio.
To explore the effect on the global desirability of weighting analytes, let’s assume we have four analytes with individual desirabilities of 0.90, 0.80, 0.70, and 0.60. What is the global desirability if you (a) weight the factors evenly by assigning each an r of 1; (b) assign a weight of 3 to the first analyte and a weight of 1 to the other three analytes; (c) assign a weight of 5 to the first analyte and a weight of 1 to the other three analytes; (d) assign a weight of 3 to the last analyte and a weight of 1 to the other three analytes; and (e) assign a weight of 2 to the second and third analytes and a weight of 1 to the first and last analyte? Examine your results and discuss any trends you see.
The global desirabilities are
(a) \(D=(0.90×0.80×0.70×0.60)^{1/4}=0.742\)
(b) \(D=((0.90)^3×0.80×0.70×0.60)^{1/6}=0.791\)
(c) \(D=((0.90)^5×0.80×0.70×0.60)^{1/8}=0.817\)
(d) \(D=(0.90×0.80×0.70×(0.60)^3 )^{1/6}=0.691\)
(e) \(D=(0.90×(0.80)^2×(0.70)^2×0.60)^{1/6}=0.744\)
Let’s use the global desirability of 0.742 in (a) as a reference as in this case we assign an equal importance to each analyte. In (b) we see that increasing the relative importance of the first analyte, which has the largest individual desirability, increases the global desirability; increasing the first analyte’s relative importance further increases the global desirability, as seen in (c). For (d) we see that increasing the relative importance of the last analyte, which has the smallest individual desirability, decreases the global desirability. In (e) we see that increasing the relative importance of the middle two analytes—one with an individual desirability slightly larger than 0.742 and one with an individual desirability slightly smaller than 0.742—yields a global desirability similar to that in (a); it is slightly larger than 0.742 because 0.80 is further from 0.742 than is 0.70.
A comparison of Figure 16 and Figure 17 shows that the global desirability function has a smaller range of maximum values than does the individual desirability function for danshensu. Which analytes limit the range of optimum values for the global desirability function? Based on Figure 17, what is the range of extraction times and range of solvent-to-solid ratios that result in an optimum global desirability? Given the range of possible values for the extraction time and the solvent-to-solid ratio, what values are the best option? Why?
To evaluate the relative importance of an analyte, recall that its individual desirability has a value of 1.00 when its extraction yield is greater than 95% of its maximum extraction yield. As an example, consider the response surface for danshensu, an annotated version of which is shown here. Danshensu’s maximum extraction yield (see Investigation 25) is 0.821 mg/g, and 95% of this value is 0.78 mg/g. From Figure 10, we see that 0.78 mg/g corresponds to the fifth contour line and that everything to the right of this contour line has a individual desirability of 1.00.
A similar analysis for the other analytes shows that cryptotanshinone has an individual desirability of 1.00 when its extraction yield is greater than 0.84 mg/g, that tanshinone I has an individual desirability of 1.00 when its extraction yield is greater than 1.28 mg/g, and that tanshinone IIA has an individual desirability of 1.00 when its extraction yield is greater than 2.65 mg/g; in all three cases, these encompass large portions of their overall response surfaces (see Figures 13, 14, and 15, respectively). This is not the case for lithospermic acid (its individual desirability is 1.00 when its extraction yield exceeds 2.58 mg/g) or for salvianolic acid A (its individual desirability is 1.00 when its extraction yield exceeds 0.59 mg/g); for both analytes, the maximum individual desirability is limited to a small area in the response surface’s upper right corner (see Figures 11 and 12, respectively; thus, lithospermic acid and salvianolic acid A limit the choice of factor levels.
From Figure 17, the area encompassing a global desirability of 1.00 includes the following combinations of extraction times and solvent-to-solid ratios:
7.20 min and 37.0–39.0 mL/g
7.40 min and 34.0–39.0 mL/g
7.60 min and 33.0–39.0 mL/g
7.80 min and 32.0–39.0 mL/g
Any extraction time and solvent-to-solid ratio in this area will work; an extraction time of 7.50 min and a solvent-to-solid ratio of 35.0 mL/g, which is in the center of this area, is a reasonable compromise.
Our final optimized conditions for extracting Danshen are a solvent that is 80% methanol and 20% water (by volume), a temperature of 70°C, a microwave power of 800 W, an extraction time of 7.50 min, and a solvent-to-solid ratio of 35.0 mL/g.
Note: Although this case study does not include salvianolic acid B, which is included in the original paper, the optimized conditions arrived at here are identical to those in the original paper.