5.3: Temperature-Programmed Desorption Mass Spectroscopy Applied in Surface Chemistry
- Page ID
- 55898
The temperature-programmed desorption (TPD) technique is often used to monitor surface interactions between adsorbed molecules and substrate surface. Utilizing the dependence on temperature is able to discriminate between processes with different activation parameters, such as activation energy, rate constant, reaction order and Arrhenius pre-exponential factorIn order to provide an example of the set-up and results from a TPD experiment we are going to use an ultra-high vacuum (UHV) chamber equipped with a quadrupole mass spectrometer to exemplify a typical surface gas-solid interaction and estimate several important kinetic parameters.
Experimental System
Ultra-high Vacuum (UHV) Chamber
When we start to set up an apparatus for a typical surface TPD experiment, we should first think about how we can generate an extremely clean environment for the solid substrate and gas adsorbents. Ultra-high vacuum (UHV) is the most basic requirement for surface chemistry experiments. UHV is defined as a vacuum regime lower than 10-9 Torr. At such a low pressure the mean free path of a gas molecule is approximately 40 Km, which means gas molecules will collide and react with sample substrate in the UHV chamber many times before colliding with each other, ensuring all interactions take place on the substrate surface.
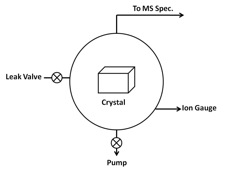
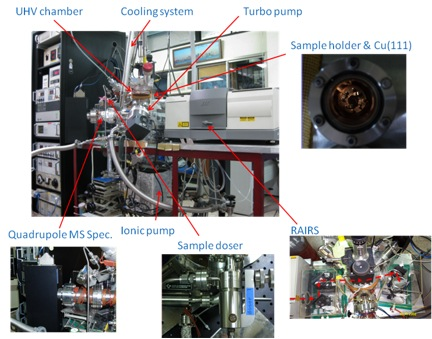
Most of time UHV chambers require the use of unusual materials in construction and by heating the entire system to ~180 °C for several hours baking to remove moisture and other trace adsorbed gases around the wall of the chamber in order to reach the ultra-high vacuum environment. Also, outgas from the substrate surface and other bulk materials should be minimized by careful selection of materials with low vapor pressures, such as stainless steel, for everything inside the UHV chamber. Thus bulk metal crystals are chosen as substrates to study interactions between gas adsorbates and crystal surface itself. Figure \(\PageIndex{1}\) shows a schematic of a TPD system, while Figure \(\PageIndex{2}\) shows a typical TPD instrument equipped with a quadrupole MS spectrometer and a reflection absorption infrared spectrometer (RAIRS).
Pumping System
There is no single pump that can operate all the way from atmospheric pressure to UHV. Instead, a series of different pumps are used, according to the appropriate pressure range for each pump. Pumps are commonly used to achieve UHV include:
- Turbomolecular pumps (turbo pumps).
- Ionic pumps.
- Titanium sublimation pumps.
- Non-evaporate mechanical pumps.
UHV pressures are measured with an ion-gauge, either a hot filament or an inverted magnetron type. Finally, special seals and gaskets must be used between components in a UHV system to prevent even trace leakage. Nearly all such seals are all metal, with knife edges on both sides cutting into a soft (e.g., copper) gasket. This all-metal seal can maintain system pressures down to ~10-12 Torr.
Manipulator and Bulk Metal Crystal
A UHV manipulator (or sample holder, see Figure \(\PageIndex{2}\)) allows an object that is inside a vacuum chamber and under vacuum to be mechanically positioned. It may provide rotary motion, linear motion, or a combination of both. The manipulator may include features allowing additional control and testing of a sample, such as the ability to apply heat, cooling, voltage, or a magnetic field. Sample heating can be accomplished by thermal radiation. A filament is mounted close to the sample and resistively heated to high temperature. In order to simplify complexity from the interaction between substrate and adsorbates, surface chemistry labs often carry out TPD experiments by choosing a substrate with single crystal surface instead of polycrystalline or amorphous substrates (see Figure \(\PageIndex{1}\)).
Pretreatment
Before selected gas molecules are dosed to the chamber for adsorption, substrates (metal crystals) need to be cleaned through argon plasma sputtering, followed by annealing at high temperature for surface reconstruction. After these pretreatments, the system is again cooled down to very low temperature (liquid N2temp), which facilitating gas molecules adsorbed on the substrate surface. Adsorption is a process in which a molecule becomes adsorbed onto a surface of another phase. It is distinguished from absorption, which is used when describing uptake into the bulk of a solid or liquid phase.
Temperature-programmed Desorption Processes
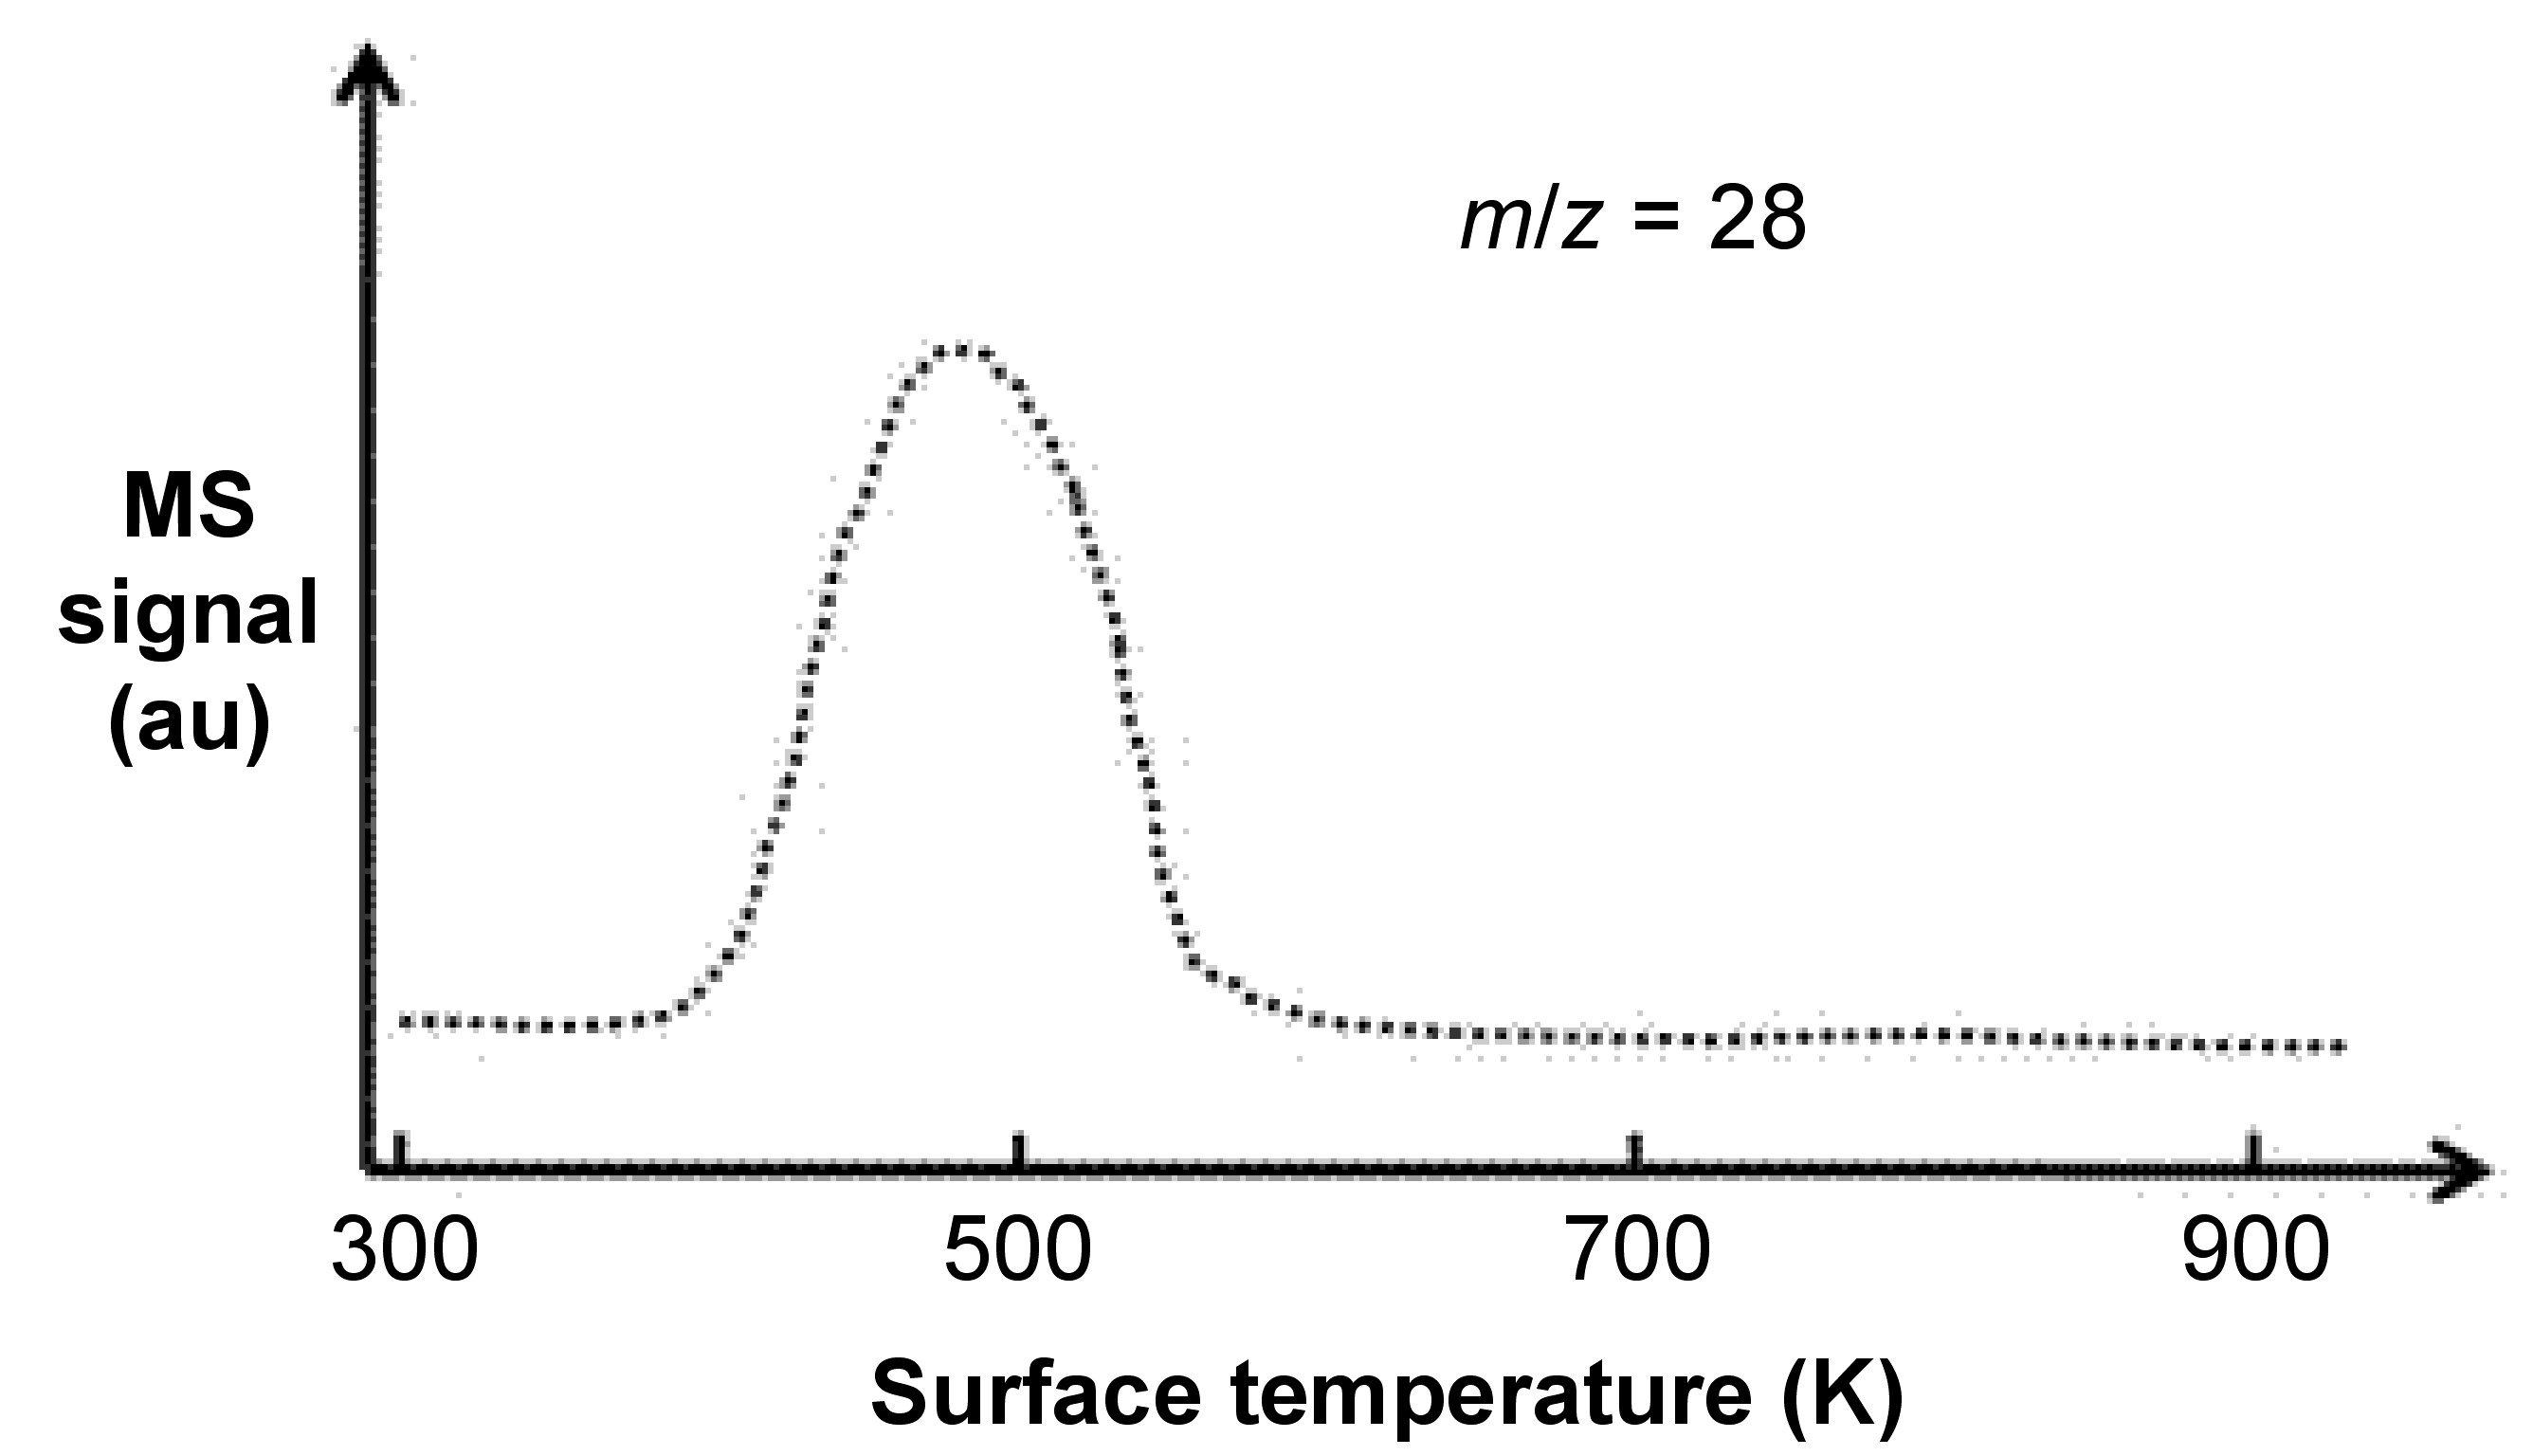
After gas molecules adsorption, now we are going to release theses adsorbates back into gas phase by programmed-heating the sample holder. A mass spectrometer is set up for collecting these desorbed gas molecules, and then correlation between desorption temperature and fragmentation of desorbed gas molecules will show us certain important information. Figure \(\PageIndex{3}\) shows a typical TPD experiment carried out by adsorbing CO onto Pd(111) surface, followed by programmed-heating to desorb the CO adsorbates.
Theory of TPD Experiment
Langmuir Isotherm
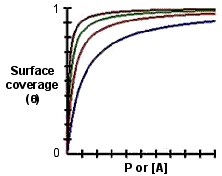
The Langmuir isotherm describes the dependence of the surface coverage of an adsorbed gas on the pressure of the gas above the surface at a fixed temperature. Langmuir isotherm is the simplest assumption, but it provides a useful insight into the pressure dependence of the extent of surface adsorption. It was Irving Langmuir who first studied the adsorption process quantitatively. In his proposed model, he supposed that molecules can adsorb only at specific sites on the surface, and that once a site is occupied by one molecule, it cannot adsorb a second molecule. The adsorption process can be represented as \ref{1}, where A is the adsorbing molecule, S is the surface site, and A─S stands for an A molecule bound to the surface site.
\[ A\ +\ S \rightarrow A\ -\ S \label{1} \]
In a similar way, it reverse desorption process can be represented as \ref{2}.
\[A\ -\ S \rightarrow A\ +\ S \label{2} \]
According to the Langmuir model, we know that the adsorption rate should be proportional to ka[A](1-θ), where θ is the fraction of the surface sites covered by adsorbate A. The desorption rate is then proportional to kdθ. ka and kd are the rate constants for the adsorption and desorption. At equilibrium, the rates of these two processes are equal, \ref{3} - \ref{4}.We can replace [A] by P, where P means the gas partial pressure, \ref{6}.
\[ k_{a} [A](1-\theta )\ =\ k_{d} \theta \label{3} \]
\[ \frac{\theta }{1\ -\ \theta }\ =\ \frac{k_{a}}{k_{d}}[A] \label{4} \]
\[ K\ =\ \frac{k_{a}}{k_{d}} \label{5} \]
\[ \theta \ =\ \frac{K[A]}{1+K[A]} \label{6} \]
\[ \theta \ =\ \frac{KP}{1+KP} \label{7} \]
We can observe the equation above and know that if [A] or P is low enough so that K[A] or KP << 1, then θ ~ K[A] or KP, which means that the surface coverage should increase linearly with [A] or P. On the contrary, if [A] or P is large enough so that K[A] or KP >> 1, then θ ~ 1. This behavior is shown in the plot of θ versus [A] or P in Figure \(\PageIndex{4}\).
Derivation of Kinetic Parameters Based on TPD Results
Here we are going to show how to use the TPD technique to estimate desorption energy, reaction energy, as well as Arrhenius pre-exponential factor. Let us assume that molecules are irreversibly adsorbed on the surface at some low temperature T0. The leak valve is closed, the valve to the pump is opened, and the “density” of product molecules is monitored with a mass spectrometer as the crystal is heated under programmed temperature \ref{8}, where β is the heating rate (~10 °C/s). We know the desorption rate depends strongly on temperature, so when the temperature of the crystal reaches a high enough value so that the desorption rate is appreciable, the mass spectrometer will begin to record a rise in density. At higher temperatures, the surface will finally become depleted of desorbing molecules; therefore, the mass spectrometer signal will decrease. According to the shape and position of the peak in the mass signal, we can learn about the activation energy for desorption and the Arrhenius pre-exponential factor.
\[ T\ =\ T_{0}\ +\ \beta T \label{8} \]
First-Order Process
Consider a first-order desorption process \ref{9}, with a rate constant kd, \ref{10}, where A is Arrhenius pre-exponential factor. If θ is assumed to be the number of surface adsorbates per unit area, the desorption rate will be given by \ref{11}.
\[ A\ -\ S \rightarrow \ A\ +\ S \label{9} \]
\[ k_{d}\ =\ Ae^{({- \Delta E_{\alpha}}}{{RT})} \label{10} \]
\[ \frac{-d\theta}{dt}\ =\ k_{d} \theta =\ \theta Ae^{({- \Delta E_{\alpha}}}{{RT})} \label{11} \]
Since we know the relationship between heat rate β and temperature on the crystal surface T, \ref{12} and \ref{13}.
\[ T\ =\ T_{0} \ +\ \beta t \label{12} \]
\[ \frac{1}{dt} \ = \ \frac{\beta }{dT} \label{13} \]
Multiplying by -dθ gives \ref{13}, since \ref{14} and \ref{15}. A plot of the form of –dθ/dT versus T is shown in Figure \(\PageIndex{5}\).
\[ \frac{-d\theta}{dt}\ =\ -\beta \frac{d\theta }{dT} \label{14} \]
\[ \frac{-d\theta}{dt}\ =\ k_{d}\ =\ \theta A e^{ (\frac{-\Delta E_{D}}{RT}}) \label{15} \]
\[ \frac{-d\theta}{dt}\ =\ \frac{\theta A}{\beta }e^{(\frac{- \Delta E_{a}}{RT})} \label{16} \]
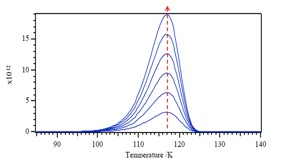
We notice that the Tm (peak maximum) in Figure \(\PageIndex{5}\)
keeps constant with increasing θ, which means the value of Tm does not depend on the initial coverage θ in the first-order desorption. If we want to use different desorption activation energy Ea and see what happens in the corresponding desorption temperature T. We are able to see the Tm values will increase with increasing Ea.
At the peak of the mass signal, the increase in the desorption rate is matched by the decrease in surface concentration per unit area so that the change in dθ/dT with T is zero: \ref{17} - \ref{18}. Since \ref{19}, then \ref{20} and \ref{21}.
\[ \frac{-d\theta }{dT}\ =\ \frac{\theta A}{\beta }e^{(\frac{- \Delta E_{a}}{RT})} \label{17} \]
\[ \frac{d}{dT} [frac{\theta A}{\beta }e^{(\frac{- \Delta E_{a}}{RT})}]\ =\ 0 \label{18} \]
\[ \frac{\Delta E_{a}}{RT^{2}_{M}} = -\frac{1}{\theta}(\frac{d\theta }{dT}) \label{19} \]
\[ -\frac{-d\theta }{dT}\ =\ \frac{\theta A}{\beta} e^{(- \frac{- \Delta E_{a}}{RT})} \label{20} \]
\[ \frac{\Delta E_{a}}{RT^{2}_{M}}\ =\ \frac{A}{\beta }e^{(- \frac{- \Delta E_{a}}{RT})} \label{21} \]
\[ 2lnT_{M}\ -\ ln \beta \ = \frac{\Delta E_{a}}{RT^{2}_{M}} + ln{\frac{\Delta E_{a}}{RA}} \label{22} \]
This tells us if different heating rates β are used and the left-hand side of the above equation is plotted as a function of 1/TM, we can see that a straight line should be obtained whose slope is ΔEa/R and intercept is ln(ΔEa/RA). So we are able to obtain the activation energy to desorption ΔEa and Arrhenius pre-exponential factor A.
Second-Order Process
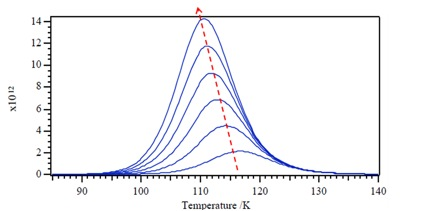
Now let consider a second-order desorption process \ref{23}, with a rate constant kd. We can deduce the desorption kinetics as \ref{24}. The result is different from the first-order reaction whose Tm value does not depend upon the initial coverage, the temperature of the peak Tm will decrease with increasing initial surface coverage.
\[ 2A\ -S \rightarrow A_{2}\ +\ 2S \label{23} \]
\[ -\frac{d\theta }{dT} =\ A \theta^{2} e^{\frac{\Delta E_{a}}{RT}} \label{24} \]
Zero-Order Process
The zero-order desorption kinetics relationship as \ref{25}. Looking at desorption rate for the zero-order reaction (Figure \(\PageIndex{7}\)), we can observe that the desorption rate does not depend on coverage and also implies that desorption rate increases exponentially with T. Also according to the plot of desorption rate versus T, we figure out the desorption rate rapid drop when all molecules have desorbed. Plus temperature of peak, Tm, moves to higher T with increasing coverage θ.
\[ - \frac{d\theta }{dT} \ =\ Ae^{(- \frac{\Delta E_{a}}{RT})} \label{25} \]

A Typical Example
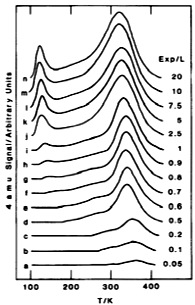
A typical TPD spectra of D2 from Rh(100) for different exposures in Langmuirs (L = 10-6 Torr-sec) shows in Figure \(\PageIndex{8}\). First we figure out the desorption peaks from g to n show two different desorbing regions. The higher one can undoubtedly be ascribed to chemisorbed D2 on Rh(100) surface, which means chemisorbed molecules need higher energy used to overcome their activation energy for desorption. The lower desorption region is then due to physisorbed D2 with much lower desorption activation energy than chemisorbed D2. According to the TPD theory we learnt, we notice that the peak maximum shifts to lower temperature with increasing initial coverage, which means it should belong to a second-order reaction. If we have other information about heating rate β and each Tm under corresponding initial surface coverage θ then we are able to calculate the desorption activation energy Ea and Arrhenius pre-exponential factor A.
Conclusion
Temperature-programmed desorption is an easy and straightforward technique especially useful to investigate gas-solid interaction. By changing one of parameters, such as coverage or heating rate, followed by running a serious of typical TPD experiments, it is possible to to obtain several important kinetic parameters (activation energy to desorption, reaction order, pre-exponential factor, etc). Based on the information, further mechanism of gas-solid interaction can be deduced.


