
5.1: Dynamic Headspace Gas Chromatography Analysis
- Page ID
- 55896

Gas chromatography (GC) is a very commonly used chromatography in analytic chemistry for separating and analyzing compounds that are gaseous or can be vaporized without decomposition. Because of its simplicity, sensitivity, and effectiveness in separating components of mixtures, gas chromatography is an important tools in chemistry. It is widely used for quantitative and qualitative analysis of mixtures, for the purification of compounds, and for the determination of such thermochemical constants as heats of solution and vaporization, vapor pressure, and activity coefficients. Compounds are separated due to differences in their partitioning coefficient between the stationary phase and the mobile gas phase in the column.
Physical Components of a GC System
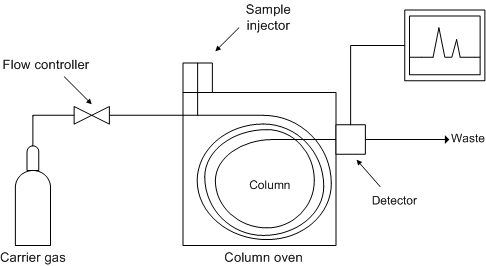
A gas chromatograph (Figure \(\PageIndex{1}\)) consists of a carrier gas system, a sampling system, a separation system, a detection system, and a data recording system.
An ideal separation is judged by resolution, efficiency, and symmetry of the desired peaks, as illustrated by
The carrier gas system consists of carrier gas sources, purification, and gas flow control. The carrier gas must be chemically inert. Commonly used gases include nitrogen, helium, argon, and carbon dioxide. The choice of carrier gas often depends upon the type of detector used. A molecular sieve is often contained in the carrier gas system to remove water and other impurities.
Auto Sampling System
An auto sampling system consists of auto sampler, and vaporization chamber. The sample to be analyzed is loaded at the injection port via a hypodermic syringe and it will be volatilized as the injection port is heated up. Typically samples of one micro liter or less are injected on the column. These volumes can be further reduced by using what is called a split injection system in which a controlled fraction of the injected sample is carried away by a gas stream before entering the column.
Separation System
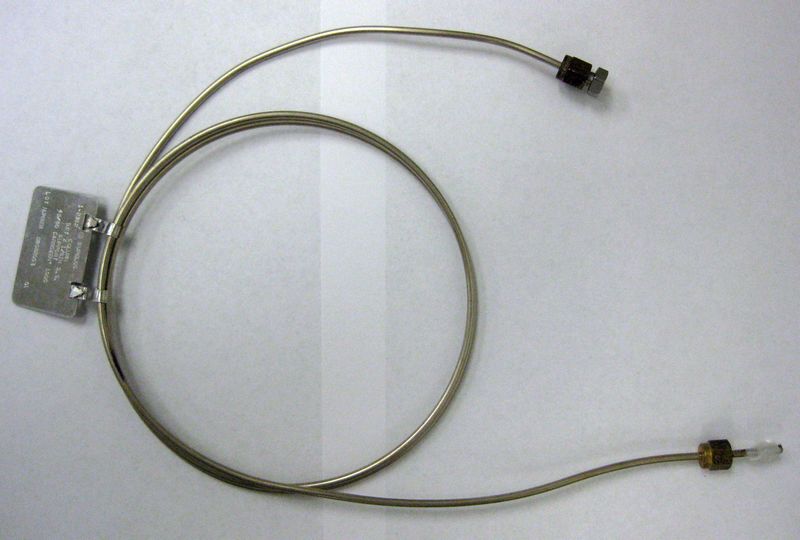
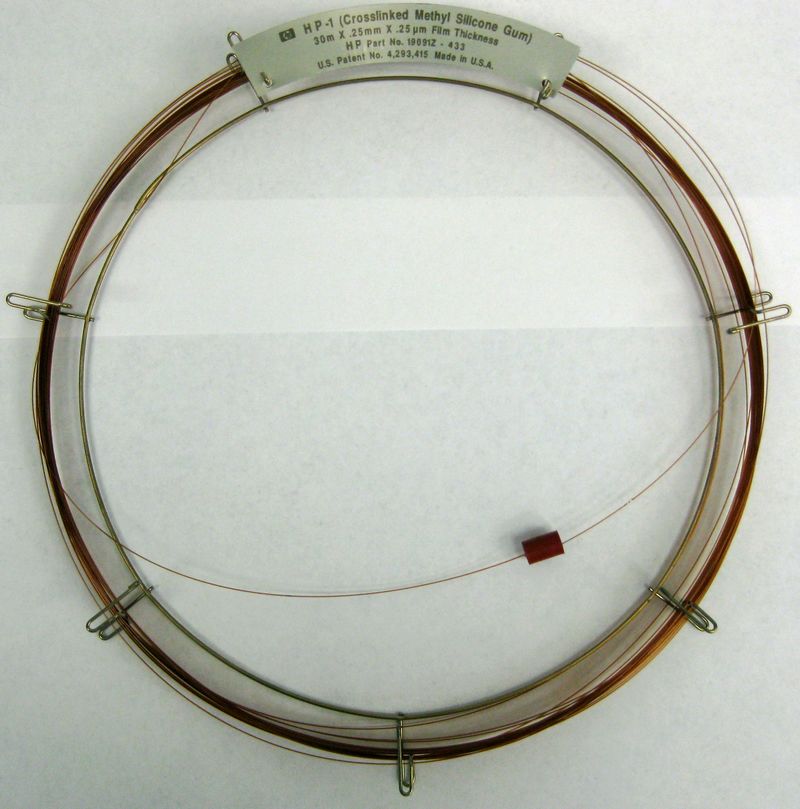
The separation system consists of columns and temperature controlling oven. The column is where the components of the sample are separated, and is the crucial part of a GC system. The column is essentially a tube that contains different stationary phases have different partition coefficients with analytes,and determine the quality of separation. There are two general types of column: packed (Figure \(\PageIndex{2}\)) and capillary also known as open tubular (Figure \(\PageIndex{3}\)).
- Packed columns contain a finely divided, inert, solid support material coated with liquid stationary phase. Most packed columns are 1.5 – 10 m in length and have an internal diameter of 2 – 4 mm.
- Capillary columns have an internal diameter of a few tenths of a millimeter. They can be one of two types; wall-coated open tubular (WCOT) or support-coated open tubular (SCOT). Wall-coated columns consist of a capillary tube whose walls are coated with liquid stationary phase. In support-coated columns, the inner wall of the capillary is lined with a thin layer of support material such as diatomaceous earth, onto which the stationary phase has been adsorbed. SCOT columns are generally less efficient than WCOT columns. Both types of capillary column are more efficient than packed columns.
Detectors
The purpose of a detector is to monitor the carrier gas as it emerges from the column and to generate a signal in response to variation in its composition due to eluted components. As it transmits physical signal into recordable electrical signal, it is another crucial part of GC. The requirements of a detector for GC are listed below.
Detectors for GC must respond rapidly to minute concentration of solutes as they exit the column, i.e., they are required to have a fast response and a high sensitivity. Other desirable properties of a detector are: linear response, good stability, ease of operation, and uniform response to a wide variety of chemical species or, alternatively predictable and selective response to one or more classes of solutes.
Recording Devices
GC system originally used paper chart readers, but modern system typically uses an online computer, which can track and record the electrical signals of the separated peaks. The data can be later analyzed by software to provide the information of the gas mixture.
How Does GC Work?
Separation Terminology
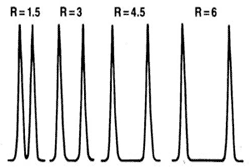
An ideal separation is judged by resolution, efficiency, and symmetry of the desired peaks, as illustrated by Figure \(\PageIndex{4}\).
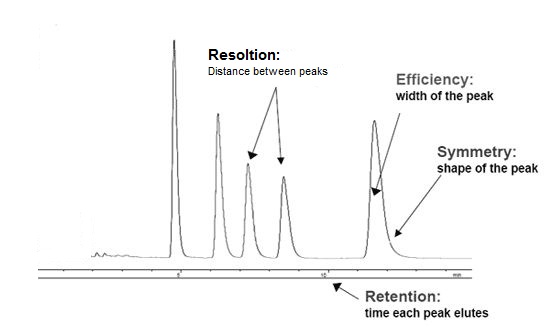
Resolution (R)
Resolution can be simply expressed as the distance on the output trace between two peaks. The highest possible resolution is the goal when developing a separation method. Resolution is defined by the R value, \ref{1}, which can be expressed mathamatically, \ref{2}, where k is capacity, α is selectivity, and N is the number of theoretical plates. An R value of 1.5 is defined as being the minimum required for baseline separation, i.e., the two adjacent peaks are separated by the baseline. Separation for different R values is illustrated in Figure \(\PageIndex{5}\).
\[ R \ =\ capacity \times selectivity \times efficiency \label{1} \]
\[ R\ =\ [k/(1+k)](\alpha -\ 1/\alpha)(N^{0.5}/4) \label{2} \]
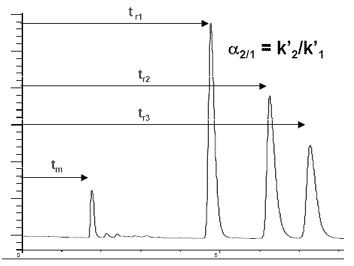
Capacity (k')
Capacity (k´) is known as the retention factor. It is a measure of retention by the stationary phase. It is calculated from \ref{3}, where tr = retention time of analyte (substance to be analyzed), and tm = retention time of an unretained compound.
\[ k'\ =\ (t_{r}-t_{m})/t_{m} \label{3} \]
Selectivity
Selectivity is related to α, the separation factor (Figure \(\PageIndex{6}\). The value of α should be large enough to give baseline resolution, but minimized to prevent waste.
Efficiency
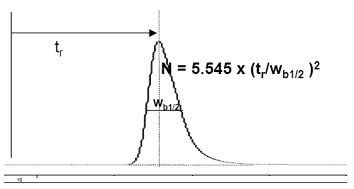
Narrow peaks have high efficiency (Figure \(\PageIndex{7}\)), and are desired. Units of efficiency are "theoretical plates" (N) and are often used to describe column performance. "Plates" is the current common term for N, is defined as a function of the retention time (tr) and the full peak width at half maximum (Wb1/2), EQ.
\[ N \ =\ 5.545(t_{r}/W_{b1/2})^{2} \label{4} \]
Peak Symmetry
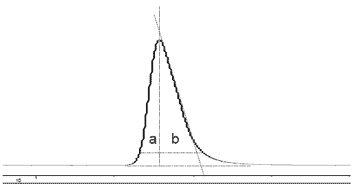
The symmetry of a peak is judged by the values of two half peak widths, a and b (Figure \(\PageIndex{8}\)). When a = b, a peak is called symmetric, which is desired. Unsymmetrical peaks are often described as "tailing" or "fronting".
An Ideal Separation
The attributions of an ideal separation are as follows:
- Should meet baseline resolution of the compounds of interest.
- Each desired peak is narrow and symmetrical.
- Has no wasted dead time between peaks.
- Takes a minimal amount of time to run.
- The result is reproducible.
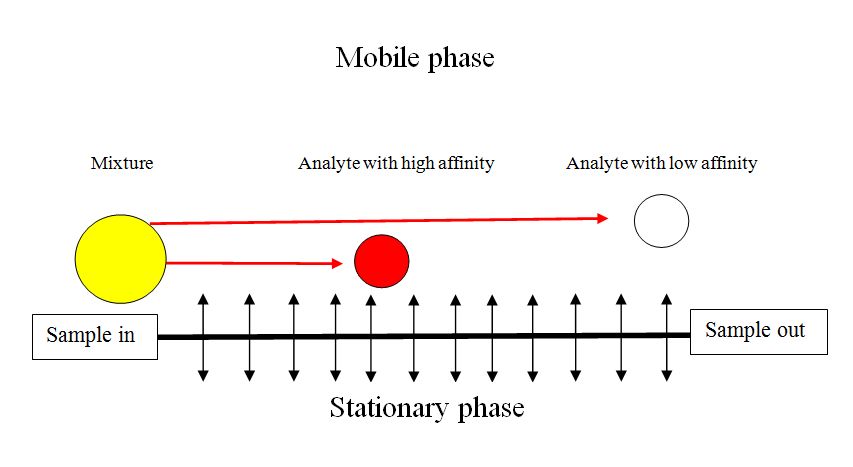
In its simplest form gas chromatography is a process whereby a sample is vaporized and injected onto the chromatographic column, where it is separated into its many components. The elution is brought about by the flow of carrier gas (Figure \(\PageIndex{9}\)).
The carrier gas serves as the mobile phase that elutes the components of a mixture from a column containing an immobilized stationary phase. In contrast to most other types of chromatography, the mobile phase does not interact with molecules of the analytes. Carrier gases, the mobile phase of GC, include helium, hydrogen and nitrogen which are chemically inert. The stationary phase in gas-solid chromatography is a solid that has a large surface area at which adsorption of the analyte species (solutes) take place. In gas-liquid chromatography, a stationary phase is liquid that is immobilized on the surface of a solid support by adsorption or by chemical bonding.
Gas chromatographic separation occurs because of differences in the positions of adsorption equilibrium between the gaseous components of the sample and the stationary phases (Figure \(\PageIndex{9}\)). In GC the distribution ratio (ratio of the concentration of analytes in stationary and mobile phase) is dependent on the component vapor pressure, the thermodynamic properties of the bulk component band and affinity for the stationary phase. The equilibrium is temperature dependent. Hence the importance of the selection the stationary phase of the column and column temperature programming in optimizing a separation.
Choice of Method
Carrier Gas and Flow Rate
Helium, nitrogen, argon, hydrogen and air are typically used carrier gases. Which one is used is usually determined by the detector being used, for example, a discharge ionization detection (DID) requires helium as the carrier gas. When analyzing gas samples, however, the carrier is sometimes selected based on the sample's matrix, for example, when analyzing a mixture in argon, an argon carrier is preferred, because the argon in the sample does not show up on the chromatogram. Safety and availability are other factors, for example, hydrogen is flammable, and high-purity helium can be difficult to obtain in some areas of the world.
The carrier gas flow rate affects the analysis in the same way that temperature does. The higher the flow rate the faster the analysis, but the lower the separation between analytes. Furthermore, the shape of peak will be also effected by the flow rate. The slower the rate is, the more axial and radical diffusion are, the broader and the more asymmetric the peak is. Selecting the flow rate is therefore the same compromise between the level of separation and length of analysis as selecting the column temperature.
Column Selection
Table \(\PageIndex{1}\) shows commonly used stationary phase in various applications.
| Stationary Phase | Common Trade Name | Temperature (Celsius) | Common Applications |
| Polydimethyl Siloxane | OV-1, SE-30 | 350 | General-purpose nonpolar phase, hydrocarbons, polynuclear aromatics, drugs, steroids, PCBs |
| Poly(phenylmethyl-dimethyl) siloxane (10% phenyl) | OV-3, SE-52 | 350 | Fatty acid methyl esters, alkaloids, drugs, halogenated compounds |
| Poly(phenylmethyl) siloxane (50% phenyl) | OV-17 | 250 | Drugs, steroids, pesticides, glycols |
| Poly(trifluoropropyl-dimethyl) siloxane | OV-210 | 200 | Chlorinated aromatics, nitroaromatics, alkyl-substituted benzenes |
| Polyethylene glycol | Carbowax 20M | 250 | Free acids, alcohols, ethers, essential oils, glycols |
| Poly(dicyanoallyldimethyl) siloxane | OV-275 | 240 | Polyunsaturated fatty acid, rosin acids, free acids, alcohols |
Column Temperature and Temperature Program
For precise work, the column temperature must be controlled to within tenths of a degree. The optimum column temperature is dependent upon the boiling point of the sample. As a rule of thumb, a temperature slightly above the average boiling point of the sample results in an elution time of 2 - 30 minutes. Minimal temperatures give good resolution, but increase elution times. If a sample has a wide boiling range, then temperature programming can be useful. The column temperature is increased (either continuously or in steps) as separation proceeds. Another effect that temperature may have is on the shape of peak as flow rate does. The higher the temperature is, the more intensive the diffusion is, the worse the shape is. Thus, a compromise has to be made between goodness of separation and retention time as well as peak shape.
Detector Selection
A number of detectors are used in gas chromatography. The most common are the flame ionization detector (FID) and the thermal conductivity detector (TCD). Both are sensitive to a wide range of components, and both work over a wide range of concentrations. While TCDs are essentially universal and can be used to detect any component other than the carrier gas (as long as their thermal conductivities are different from that of the carrier gas, at detector temperature), FIDs are sensitive primarily to hydrocarbons, and are more sensitive to them than TCD. However, an FID cannot detect water. Both detectors are also quite robust. Since TCD is non-destructive, it can be operated in-series before an FID (destructive), thus providing complementary detection of the same analytes.For halides, nitrates, nitriles, peroxides, anhydrides and organometallics, ECD is a very sensitive detection, which can detect up to 50 fg of those analytes. Different types of detectors are listed below in Table \(\PageIndex{2}\), along with their properties.
| Detector | Type | Support Gases | Selectivity | Detectability | Dynamic Range |
| Flame Ionization (FID) | Mass flow | Mass flow | Most organic compounds | 100 pg | 107 |
| Thermal Conductivity (TCD) | Concentration | Reference | Universal | 1 ng | 107 |
| Electron Capture (FCD) | Concentration | Make-up | Halides, nitrates, nitriles, peroxides, anhydrides, organometallic | 50 fg | 105 |
| Nitrogen-Phosphorus | Mass flow | Hydrogen and air | Nitrogen, phosphorus | 10 pg | 106 |
| Flame Photometric (FPD) | Mass flow | Hydrogen and air possibly oxygen | Sulphur, phosphorus, tin, boron, arsenic, germanium, selenium, chromium | 100 pg | 103 |
| Photo-ionization (PID) | Concentration | Make-up | Aliphatics, aromatics, ketones, esters, aldehydes, amines, heterocyclics, organosulphurs, some organometallics | 2 pg | 107 |
| Hall electrolytic Conductivity | Mass flow | Hydrogen, oxygen | Halide, nitrogen, nitrosamine, sulphur | - | - |
Headspace Analysis Using GC
Most consumer products and biological samples are composed of a wide variety of compounds that differ in molecular weight, polarity, and volatility. For complex samples like these, headspace sampling is the fastest and cleanest method for analyzing volatile organic compounds. A headspace sample is normally prepared in a vial containing the sample, the dilution solvent, a matrix modifier, and the headspace (Figure \(\PageIndex{10}\)). Volatile components from complex sample mixtures can be extracted from non-volatile sample components and isolated in the headspace or vapor portion of a sample vial. An aliquot of the vapor in the headspace is delivered to a GC system for separation of all of the volatile components.
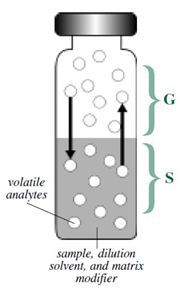
The gas phase (G in Figure \(\PageIndex{10}\)) is commonly referred to as the headspace and lies above the condensed sample phase. The sample phase (S in Figure \(\PageIndex{10}\) contains the compound(s) of interest and is usually in the form of a liquid or solid in combination with a dilution solvent or a matrix modifier. Once the sample phase is introduced into the vial and the vial is sealed, volatile components diffuse into the gas phase until the headspace has reached a state of equilibrium as depicted by the arrows. The sample is then taken from the headspace.
Basic Principles of Headspace Analysis
Partition Coefficient
Samples must be prepared to maximize the concentration of the volatile components in the headspace, and minimize unwanted contamination from other compounds in the sample matrix. To help determine the concentration of an analyte in the headspace, you will need to calculate the partition coefficient (K), which is defined by \ref{5} ,where Cs is the concentration of analyte in sample phase and Cg is the concentration of analyte in gas phase. Compounds that have low K values will tend to partition more readily into the gas phase, and have relatively high responses and low limits of detection. K can be lowered by changing the temperature at which the vial is equilibrated or by changing the composition of the sample matrix.
\[ K\ =\ C_{s}/C_{g} \label{5} \]
Phase Ratio
The phase ratio (β) is defined as the relative volume of the headspace compared to volume of the sample in the sample vial, \ref{6}, where Vs=volume of sample phase and Vg=volume of gas phase. Lower values for β (i.e., larger sample size) will yield higher responses for volatile compounds. However, decreasing the β value will not always yield the increase in response needed to improve sensitivity. When β is decreased by increasing the sample size, compounds with high K values partition less into the headspace compared to compounds with low K values, and yield correspondingly smaller changes in Cg. Samples that contain compounds with high K values need to be optimized to provide the lowest K value before changes are made in the phase ratio.
\[ \beta \ =\ V_{g}/V_{s} \label{6} \]