
4.9: X-ray Photoelectron Spectroscopy
- Page ID
- 55891

XPS of Carbon Nanomaterials
X-ray photoelectron spectroscopy (XPS), also called electron spectroscopy for chemical analysis (ESCA), is a method used to determine the elemental composition of a material’s surface. It can be further applied to determine the chemical or electronic state of these elements.
The photoelectric effect is the ejection of electrons from the surface of a material upon exposure to electromagnetic radiation of sufficient energy. Electrons emitted have characteristic kinetic energies proportional to the energy of the radiation, according to \ref{1}, where KE is the kinetic energy of the electron, h is Planck’s constant, ν is the frequency of the incident radiation, Eb is the ionization, or binding, energy, and φ is the work function. The work function is a constant which is dependent upon the spectrometer.
\[ KE\ =\ h \nu \ -\ E_{b}\ -\ \varphi \label{1} \]
In photoelectron spectroscopy, high energy radiation is used to expel core electrons from a sample. The kinetic energies of the resulting core electrons are measured. Using the equation with the kinetic energy and known frequency of radiation, the binding energy of the ejected electron may be determined. By Koopman’s theorem, which states that ionization energy is equivalent to the negative of the orbital energy, the energy of the orbital from which the electron originated is determined. These orbital energies are characteristic of the element and its state.
Basics of XPS
Sample Preparation
As a surface technique, samples are particularly susceptible to contamination. Furthermore, XPS samples must be prepared carefully, as any loose or volatile material could contaminate the instrument because of the ultra-high vacuum conditions. A common method of XPS sample preparation is embedding the solid sample into a graphite tape. Samples are usually placed on 1 x 1 cm or 3 x 3 cm sheets.
Experimental Set-up
Monochromatic aluminum (hν = 1486.6 eV) or magnesium (hν = 1253.6 eV) Kα X-rays are used to eject core electrons from the sample. The photoelectrons ejected from the material are detected and their energies measured. Ultra-high vacuum conditions are used in order to minimize gas collisions interfering with the electrons before they reach the detector.
Measurement Specifications
XPS analyzes material between depths of 1 and 10 nm, which is equivalent to several atomic layers, and across a width of about 10 µm. Since XPS is a surface technique, the orientation of the material affects the spectrum collected.
Data Collection
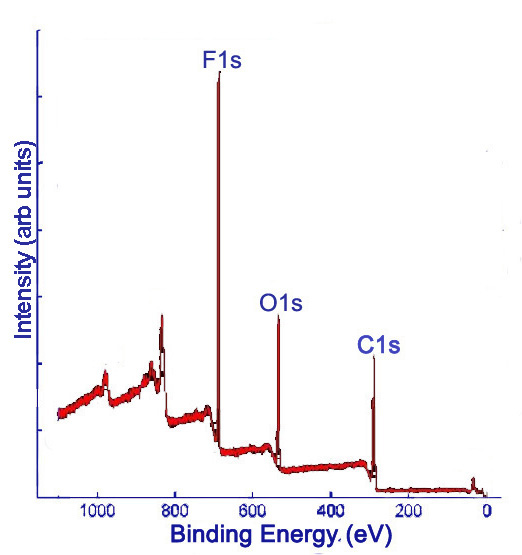
X-ray photoelectron (XP) spectra provide the relative frequencies of binding energies of electrons detected, measured in electron-volts (eV). Detectors have accuracies on the order of ±0.1 eV. The binding energies are used to identify the elements to which the peaks correspond. XPS data is given in a plot of intensity versus binding energy. Intensity may be measured in counts per unit time (such as counts per second, denoted c/s). Often, intensity is reported as arbitrary units (arb. units), since only relative intensities provide relevant information. Comparing the areas under the peaks gives relative percentages of the elements detected in the sample. Initially, a survey XP spectrum is obtained, which shows all of the detectable elements present in the sample. Elements with low detection or with abundances near the detection limit of the spectrometer may be missed with the survey scan. Figure \(\PageIndex{1}\) shows a sample survey XP scan of fluorinated double-walled carbon nanotubes (DWNTs).
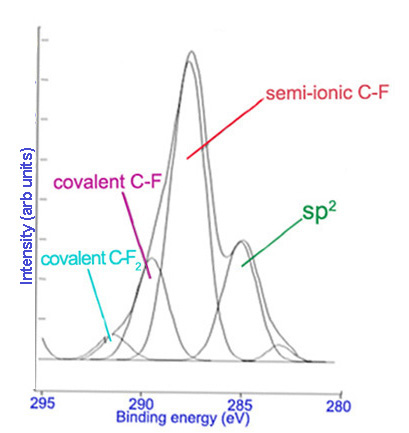
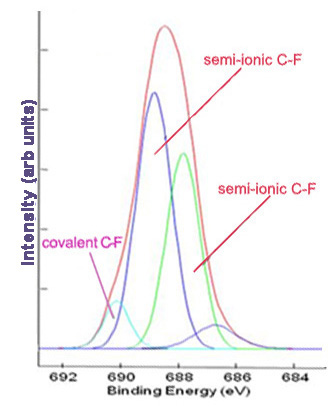
Subsequently, high resolution scans of the peaks can be obtained to give more information. Elements of the same kind in different states and environments have slightly different characteristic binding energies. Computer software is used to fit peaks within the elemental peak which represent different states of the same element, commonly called deconvolution of the elemental peak. Figure \(\PageIndex{2}\) and Figure \(\PageIndex{3}\) show high resolutions scans of C1s and F1s peaks, respectively, from Figure \(\PageIndex{1}\), along with the peak designations.
Limitations
Both hydrogen and helium cannot be detected using XPS. For this reason, XPS can provide only relative, rather than absolute, ratios of elements in a sample. Also, elements with relatively low atomic percentages close to that of the detection limit or low detection by XPS may not be seen in the spectrum. Furthermore, each peak represents a distribution of observed binding energies of ejected electrons based on the depth of the atom from which they originate, as well as the state of the atom. Electrons from atoms deeper in the sample must travel through the above layers before being liberated and detected, which reduces their kinetic energies and thus increases their apparent binding energies. The width of the peaks in the spectrum consequently depends on the thickness of the sample and the depth to which the XPS can detect; therefore, the values obtained vary slightly depending on the depth of the atom. Additionally, the depth to which XPS can analyze depends on the element being detected.
High resolution scans of a peak can be used to distinguish among species of the same element. However, the identification of different species is discretionary. Computer programs are used to deconvolute the elemental peak. The peaks may then be assigned to particular species, but the peaks may not correspond with species in the sample. As such, the data obtained must be used cautiously, and care should be taken to avoid over-analyzing data.
XPS for Carbon Nanomaterials
Despite the aforementioned limitations, XPS is a powerful surface technique that can be used to accurately detect the presence and relative quantities of elements in a sample. Further analysis can provide information about the state and environment of atoms in the sample, which can be used to infer information about the surface structure of the material. This is particularly useful for carbon nanomaterials, in which surface structure and composition greatly influence the properties of the material. There is much research interest in modifying carbon nanomaterials to modulate their properties for use in many different applications.
Sample Preparation
Carbon nanomaterials present certain issues in regard to sample preparation. The use of graphite tape is a poor option for carbon nanomaterials because the spectra will show peaks from the graphite tape, adding to the carbon peak and potentially skewing or overwhelming the data. Instead, a thin indium foil (between 0.1 and 0.5 mm thick) is used as the sample substrate. The sample is simply pressed onto a piece of the foil.
Analysis and Applications for Carbon Nanomaterials
Chemical Speciation
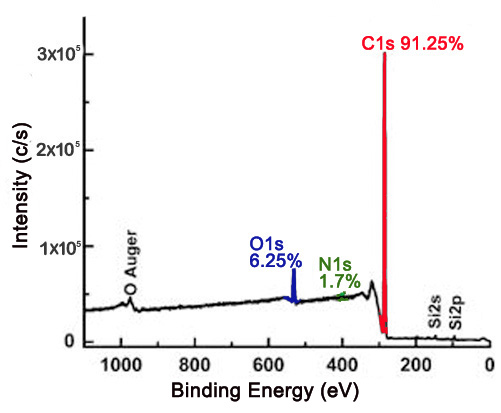
The XP survey scan is an effective way to determine the identity of elements present on the surface of a material, as well as the approximate relative ratios of the elements detected. This has important implications for carbon nanomaterials, in which surface composition is of greatest importance in their uses. XPS may be used to determine the purity of a material. For example, nanodiamond powder is a created by detonation, which can leave nitrogenous groups and various oxygen containing groups attached to the surface. Figure \(\PageIndex{4}\) shows a survey scan of a nanodiamond thin film with the relative atomic percentages of carbon, oxygen, and nitrogen being 91.25%, 6.25%, and 1.7%, respectively. Based on the XPS data, the nanodiamond material is approximately 91.25% pure.
XPS is a useful method to verify the efficacy of a purification process. For example, high-pressure CO conversion single-walled nanotubes (HiPco SWNTs) are made using iron as a catalyst, Figure \(\PageIndex{5}\) shows the Fe2p XP spectra for pristine and purified HiPco SWNTs.
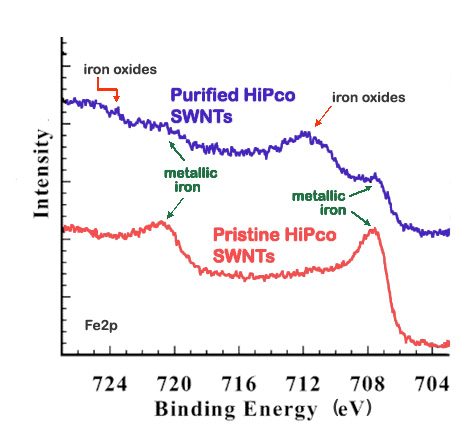
For this application, XPS is often done in conjunction with thermogravimetric analysis (TGA), which measures the weight lost from a sample at increasing temperatures. TGA data serves to corroborate the changes observed with the XPS data by comparing the percentage of weight loss around the region of the impurity suspected based on the XP spectra. The TGA data support the reduction in iron content with purification suggested by the XP spectra above, for the weight loss at temperatures consistent with iron loss decreases from 27% in pristine SWNTs to 18% in purified SWNTs. Additionally, XPS can provide information about the nature of the impurity. In Figure \(\PageIndex{6}\), the Fe2p spectrum for pristine HiPco SWNTs shows two peaks characteristic of metallic iron at 707 and 720 eV. In contrast, the Fe2p spectrum for purified HiPco SWNTs also shows two peaks at 711 and 724 eV, which are characteristic of either Fe2O3 or Fe3O4. In general, the atomic percentage of carbon obtained from the XPS spectrum is a measure of the purity of the carbon nanomaterials.
Bonding and Functional Groups
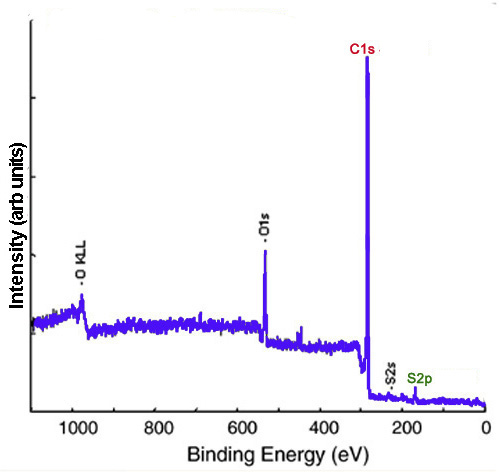
XP spectra give evidence of functionalization and can provide insight into the identity of the functional groups. Carbon nanomaterials provide a versatile surface which can be functionalized to modulate their properties. For example, the sodium salt of phenyl sulfonated SWNTs is water soluble. In the XP survey scan of the phenyl sulfonated SWNTs, there is evidence of functionalization owing to the appearance of the S2p peak. Figure \(\PageIndex{6}\) shows the survey XP spectrum of phenyl sulfonated SWNTs.
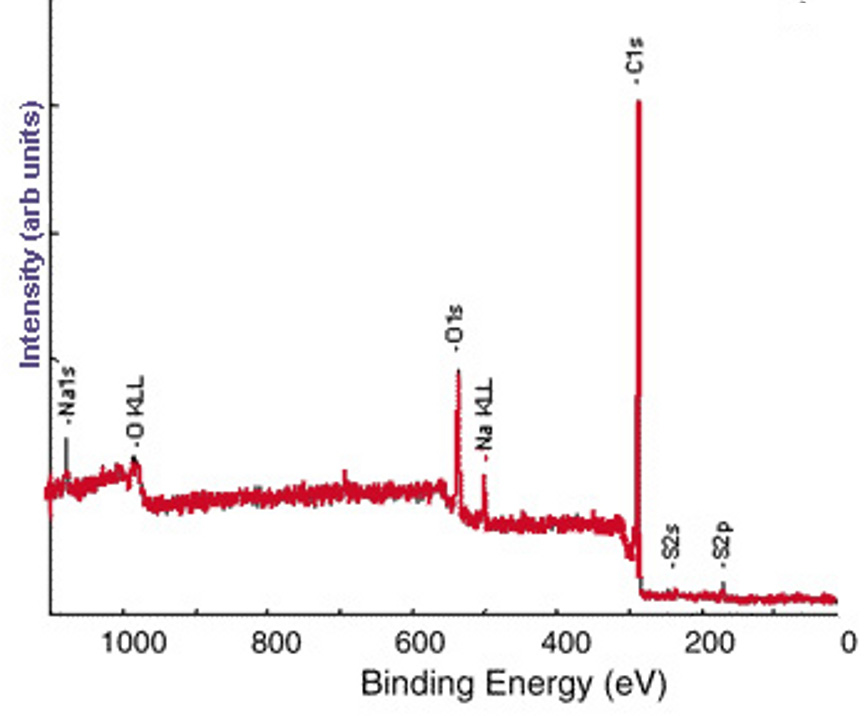
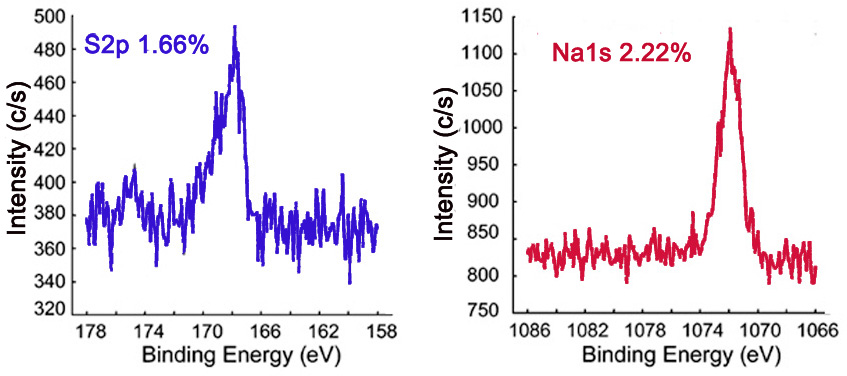
The survey XP spectrum of the sodium salt shows a Na1s peak (Figure \(\PageIndex{7}\) and the high resolution scans of Na1s and S2p show that the relative atomic percentages of Na1s and S2p are nearly equal (Figure \(\PageIndex{8}\), which supports the formation of the sodium salt.
Further Characterization
High resolution scans of each of the element peaks of interest can be obtained to give more information about the material. This is a way to determine with high accuracy the presence of elements as well as relative ratios of elements present in the sample. This can be used to distinguish species of the same element in different chemical states and environments, such as through bonding and hybridization, present in the material. The distinct peaks may have binding energies that differ slightly from that of the convoluted elemental peak. Assignment of peaks can be done using XPS databases, such as that produced by NIST. The ratios of the intensities of these peaks can be used to determine the percentage of atoms in a particular state. Discrimination between and identity of elements in different states and environments is a strength of XPS that is of particular interest for carbon nanomaterials.
Hybridization
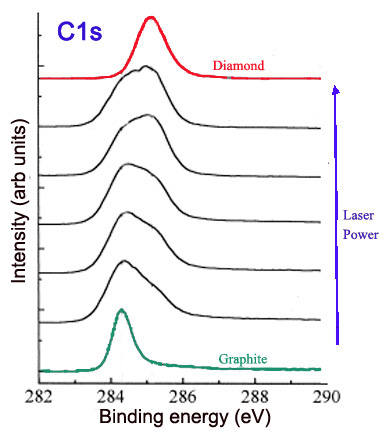
The hybridization of carbons influences the properties of a carbon nanomaterial and has implications in its structure. XPS can be used to determine the hybridization of carbons on the surface of a material, such as graphite and nanodiamond. Graphite is a carbon material consisting of sp2 carbons. Thus, theoretically the XPS of pure graphite would show a single C1s peak, with a binding energy characteristic of sp2 carbon (around 284.2 eV). On the other hand, nanodiamond consists of sp3 bonded carbons. The XPS of nanodiamond should show a single C1s peak, with a binding energy characteristic of sp3 carbon (around 286 eV). The ratio of the sp2 and sp3 peaks in the C1s spectrum gives the ratio of sp2 and sp3 carbons in the nanomaterial. This ratio can be altered and compared by collecting the C1s spectra. For example, laser treatment of graphite creates diamond-like material, with more sp3 character when a higher laser power is used. This can be observed in Figure \(\PageIndex{9}\), in which the C1s peak is broadened and shifted to higher binding energies as increased laser power is applied.
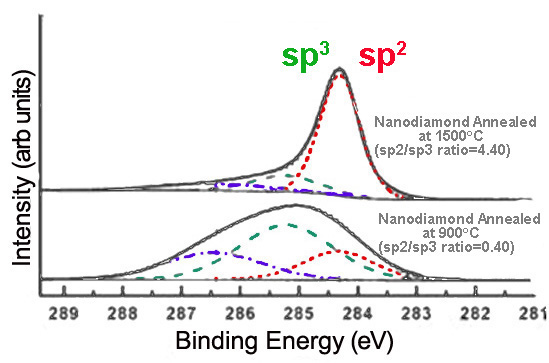
Alternatively, annealing nanodiamond thin films at very high temperatures creates graphitic layers on the nanodiamond surface, increasing sp2 content. The extent of graphitization increases with the temperature at which the sample is annealed, as shown in Figure \(\PageIndex{10}\).
Reaction Completion
Comparing the relative intensities of various C1s peaks can be powerful in verifying that a reaction has occurred. Fluorinated carbon materials are often used as precursors to a broad range of variously functionalized materials. Reaction of fluorinated SWNTs (F-SWNTs) with polyethyleneimine (PEI) leads to decreases in the covalent carbon-fluoride C1s peak, as well as the evolution of the amine C1s peak. These changes are observed in the C1s spectra of the two samples (Figure \(\PageIndex{11}\)).
Nature and Extent of Functionalization
XPS can also be applied to determine the nature and extent of functionalization. In general, binding energy increases with decreasing electron density about the atom. Species with more positive oxidation states have higher binding energies, while more reduced species experience a greater degree of shielding, thus increasing the ease of electron removal.
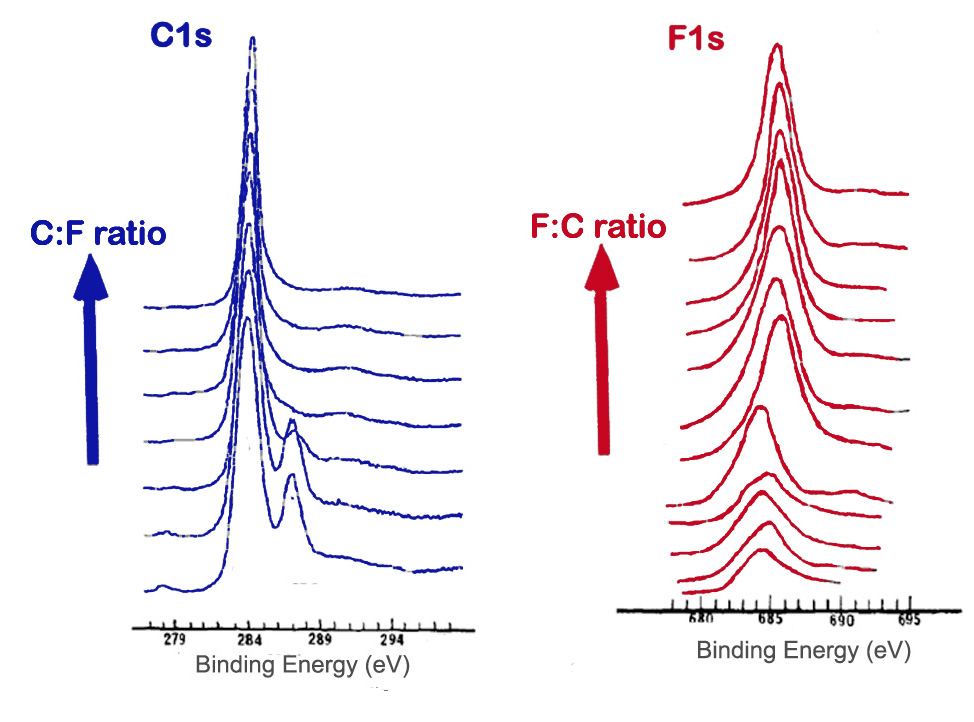
The method of fluorination of carbon materials and such factors as temperature and length of fluorination affect the extent of fluoride addition as well as the types of carbon-fluorine bonds present. A survey scan can be used to determine the amount of fluorine compared to carbon. High resolution scans of the C1s and F1s peaks can also give information about the proportion and types of bonds. A shift in the peaks, as well as changes in peak width and intensity, can be observed in spectra as an indication of fluorination of graphite. Figure \(\PageIndex{12}\) shows the Cls and F1s spectra of samples containing varying ratios of carbon to fluorine.
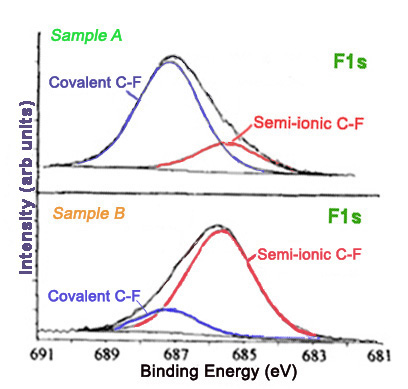
Furthermore, different carbon-fluorine bonds show characteristic peaks in high resolution C1s and F1s spectra. The carbon-fluorine interactions in a material can range from ionic to covalent. Covalent carbon-fluorine bonds show higher core electron binding energies than bonds more ionic in character. The method of fluorination affects the nature of the fluorine bonds. Graphite intercalation compounds are characterized by ionic carbon-fluorine bonding. Figure \(\PageIndex{13}\) shows the F1s spectra for two fluorinated exfoliated graphite samples prepared with different methods.
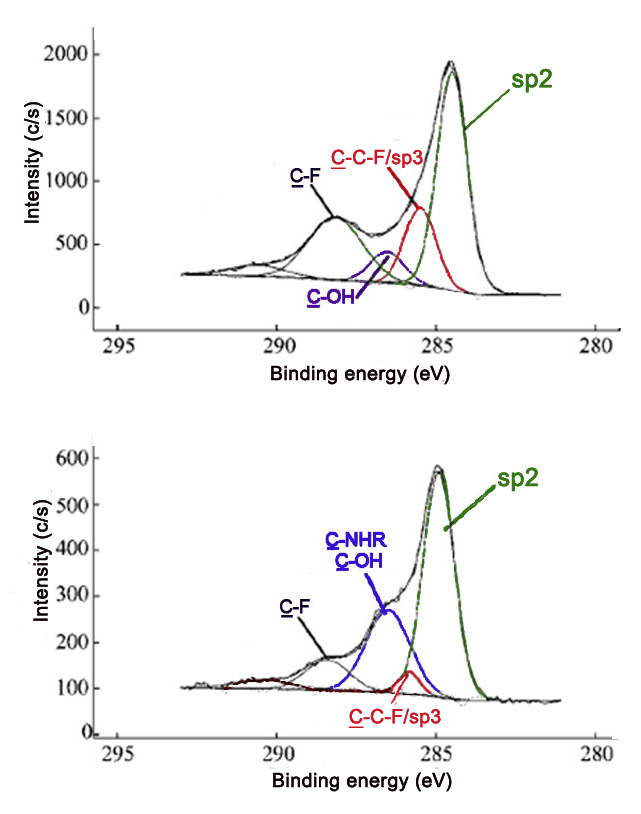
Also, the peaks for carbons attached to a single fluorine atom, two fluorine atoms, and carbons attached to fluorines have characteristic binding energies. These peaks are seen in that C1s spectra of F- and PEI-SWNTs shown in Figure \(\PageIndex{14}\).
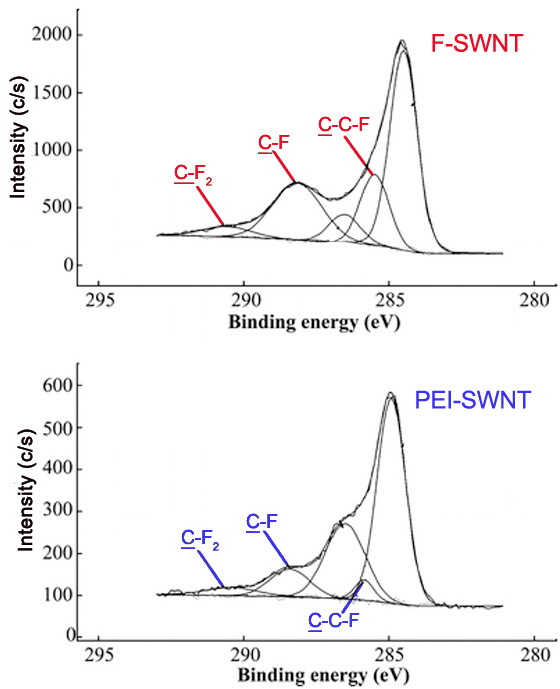
Table \(\PageIndex{1}\) lists various bonds and functionalities and the corresponding C1s binding energies, which may be useful in assigning peaks in a C1s spectrum, and consequently in characterizing the surface of a material.
| Bond/Group | Binding Energy (eV) |
| C-C | 284.0 - 286.0 |
| C-C (sp2) | 284.3 - 284.6 |
| C-C (sp3) | 285.0 - 286.0 |
| C-N | 285.2 - 288.4 |
| C-NR2 (amine) | 285.5 - 286.4 |
| O=C-NH (amide) | 287.9 - 288.6 |
| -C=N (nitrile) | 266.3 - 266.8 |
| C-O | 286.1-290.0 |
| O=C-OH (carboxyl) | 288.0 - 290.0 |
| -C-O (epoxy) | 286.1 - 287.1 |
| -C-OH (hydroxyl) | 286.4 - 286.7 |
| -C-O-C- (ether) | 286.1 - 288.0 |
| -C=O (aldehyde/ketone) | 287.1 - 288.1 |
| C-F | 287.0-293.4 |
| -C-F (covalent) | 287.7 - 290.2 |
| -C-F (ionic) | 287.0 - 287.4 |
| C-C-F | 286.0 - 287.7 |
| C-F2 | 291.6 - 292.4 |
| C-F3 | 292.4 - 293.4 |
| C-S | 285.2 - 287.5 |
| C-Cl | 287.0 - 287.2 |
Conclusion
X-ray photoelectron spectroscopy is a facile and effective method for determining the elemental composition of a material’s surface. As a quantitative method, it gives the relative ratios of detectable elements on the surface of the material. Additional analysis can be done to further elucidate the surface structure. Hybridization, bonding, functionalities, and reaction progress are among the characteristics that can be inferred using XPS. The application of XPS to carbon nanomaterials provides much information about the material, particularly the first few atomic layers, which are most important for the properties and uses of carbon nanomaterials.