
9.4: Catalyst Characterization Using Thermal Conductivity Detector
- Page ID
- 55930

Introduction
A catalyst is a "substance that accelerates the rate of chemical reactions without being consumed". Some reactions, such as the hydrodechlorination of TCE, \ref{1}, don't occur spontaneously, but can occur in the presence of a catalyst.
\[ C_{2}Cl_{3}H\ +\ 4H_{2} \underset{PD}\rightarrow C_{2}H_{6}\ +\ 3HCl \label{1} \]
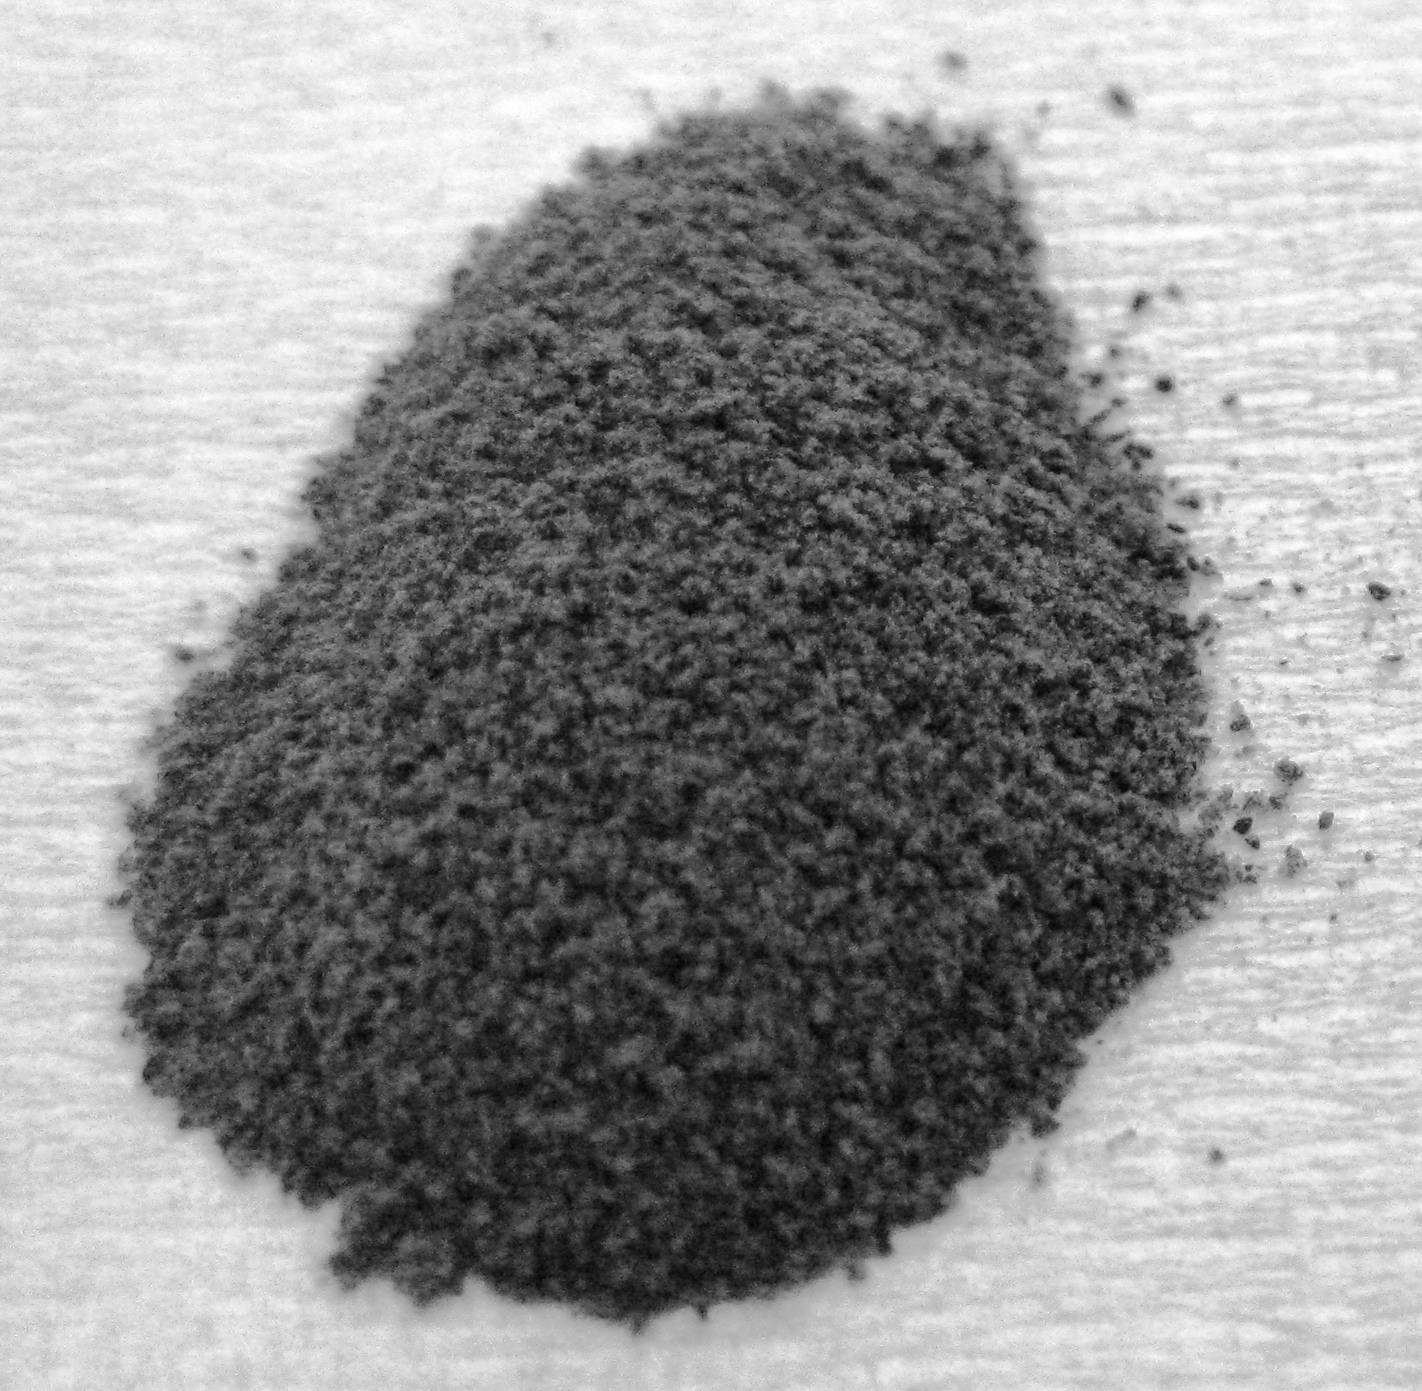
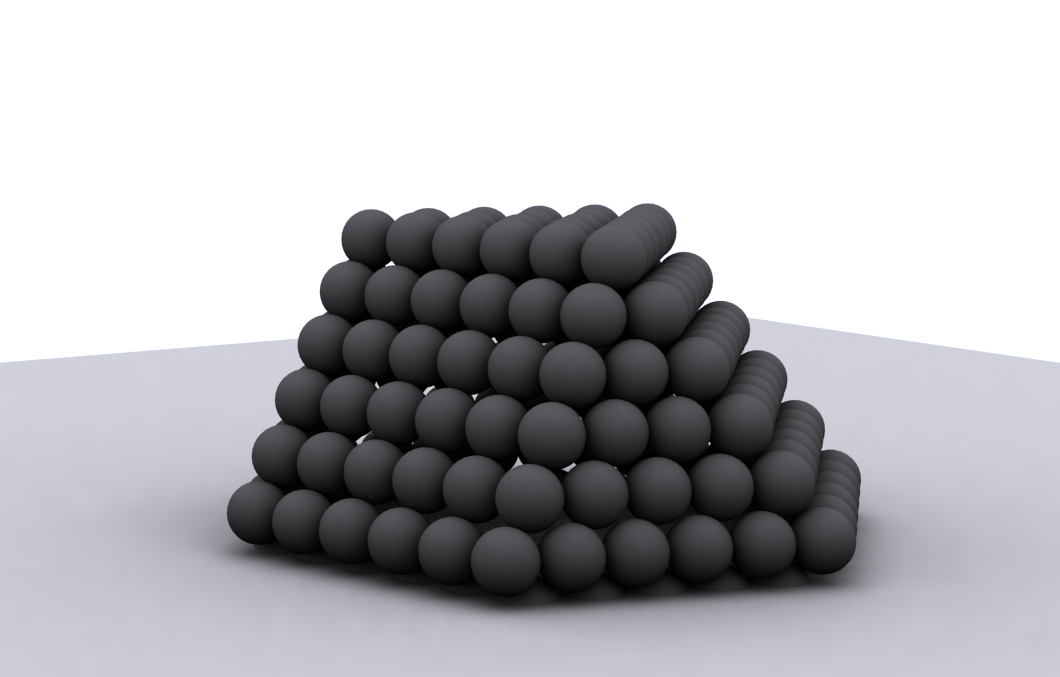
Metal dispersion is a commong term within the catalyst industry. The term refers to the amount of metal that is active for a specific reaction. Let’s assume a catalyst material has a composition of 1 wt% palladium and 99% alumina (Al2O3) (Figure \(\PageIndex{1}\)) Even though the catalyst material has 1 wt% of palladium, not all the palladium is active. The material might be oxidized due to air exposure or some of the material is not exposed to the surface (Figure \(\PageIndex{2}\)), hence it can’t participate in the reaction. For this reason it is important to characterize the material.
In order for Pd to react according to \ref{1}, it needs to be in the metallic form. Any oxidized palladium will be inactive. Thus, it is important to determine the oxidation state of the Pd atoms on the surface of the material. This can be accomplished using an experiment called temperature programmed reduction (TPR). Subsequently, the percentage of active palladium can be determined by hydrogen chemisorption. The percentage of active metal is an important parameter when comparing the performance of multiple catalyst. Usually the rate of reaction is normalized by the amount of active catalyst.
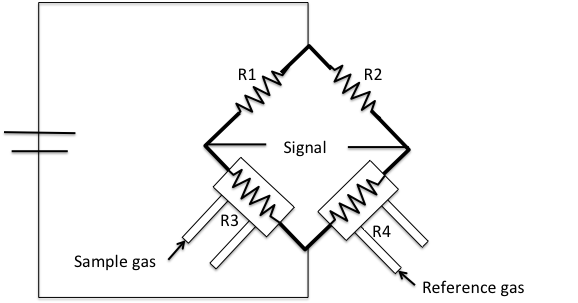
Principle of Thermal Conductivity
Thermal conductivity is the ability of a chemical specie to conduct heat. Each gas has a different thermal conductivity. The units of thermal conductivity in the international system of units are W/m·K. Table \(\PageIndex{1}\) shows the thermal conductivity of some common gasses.
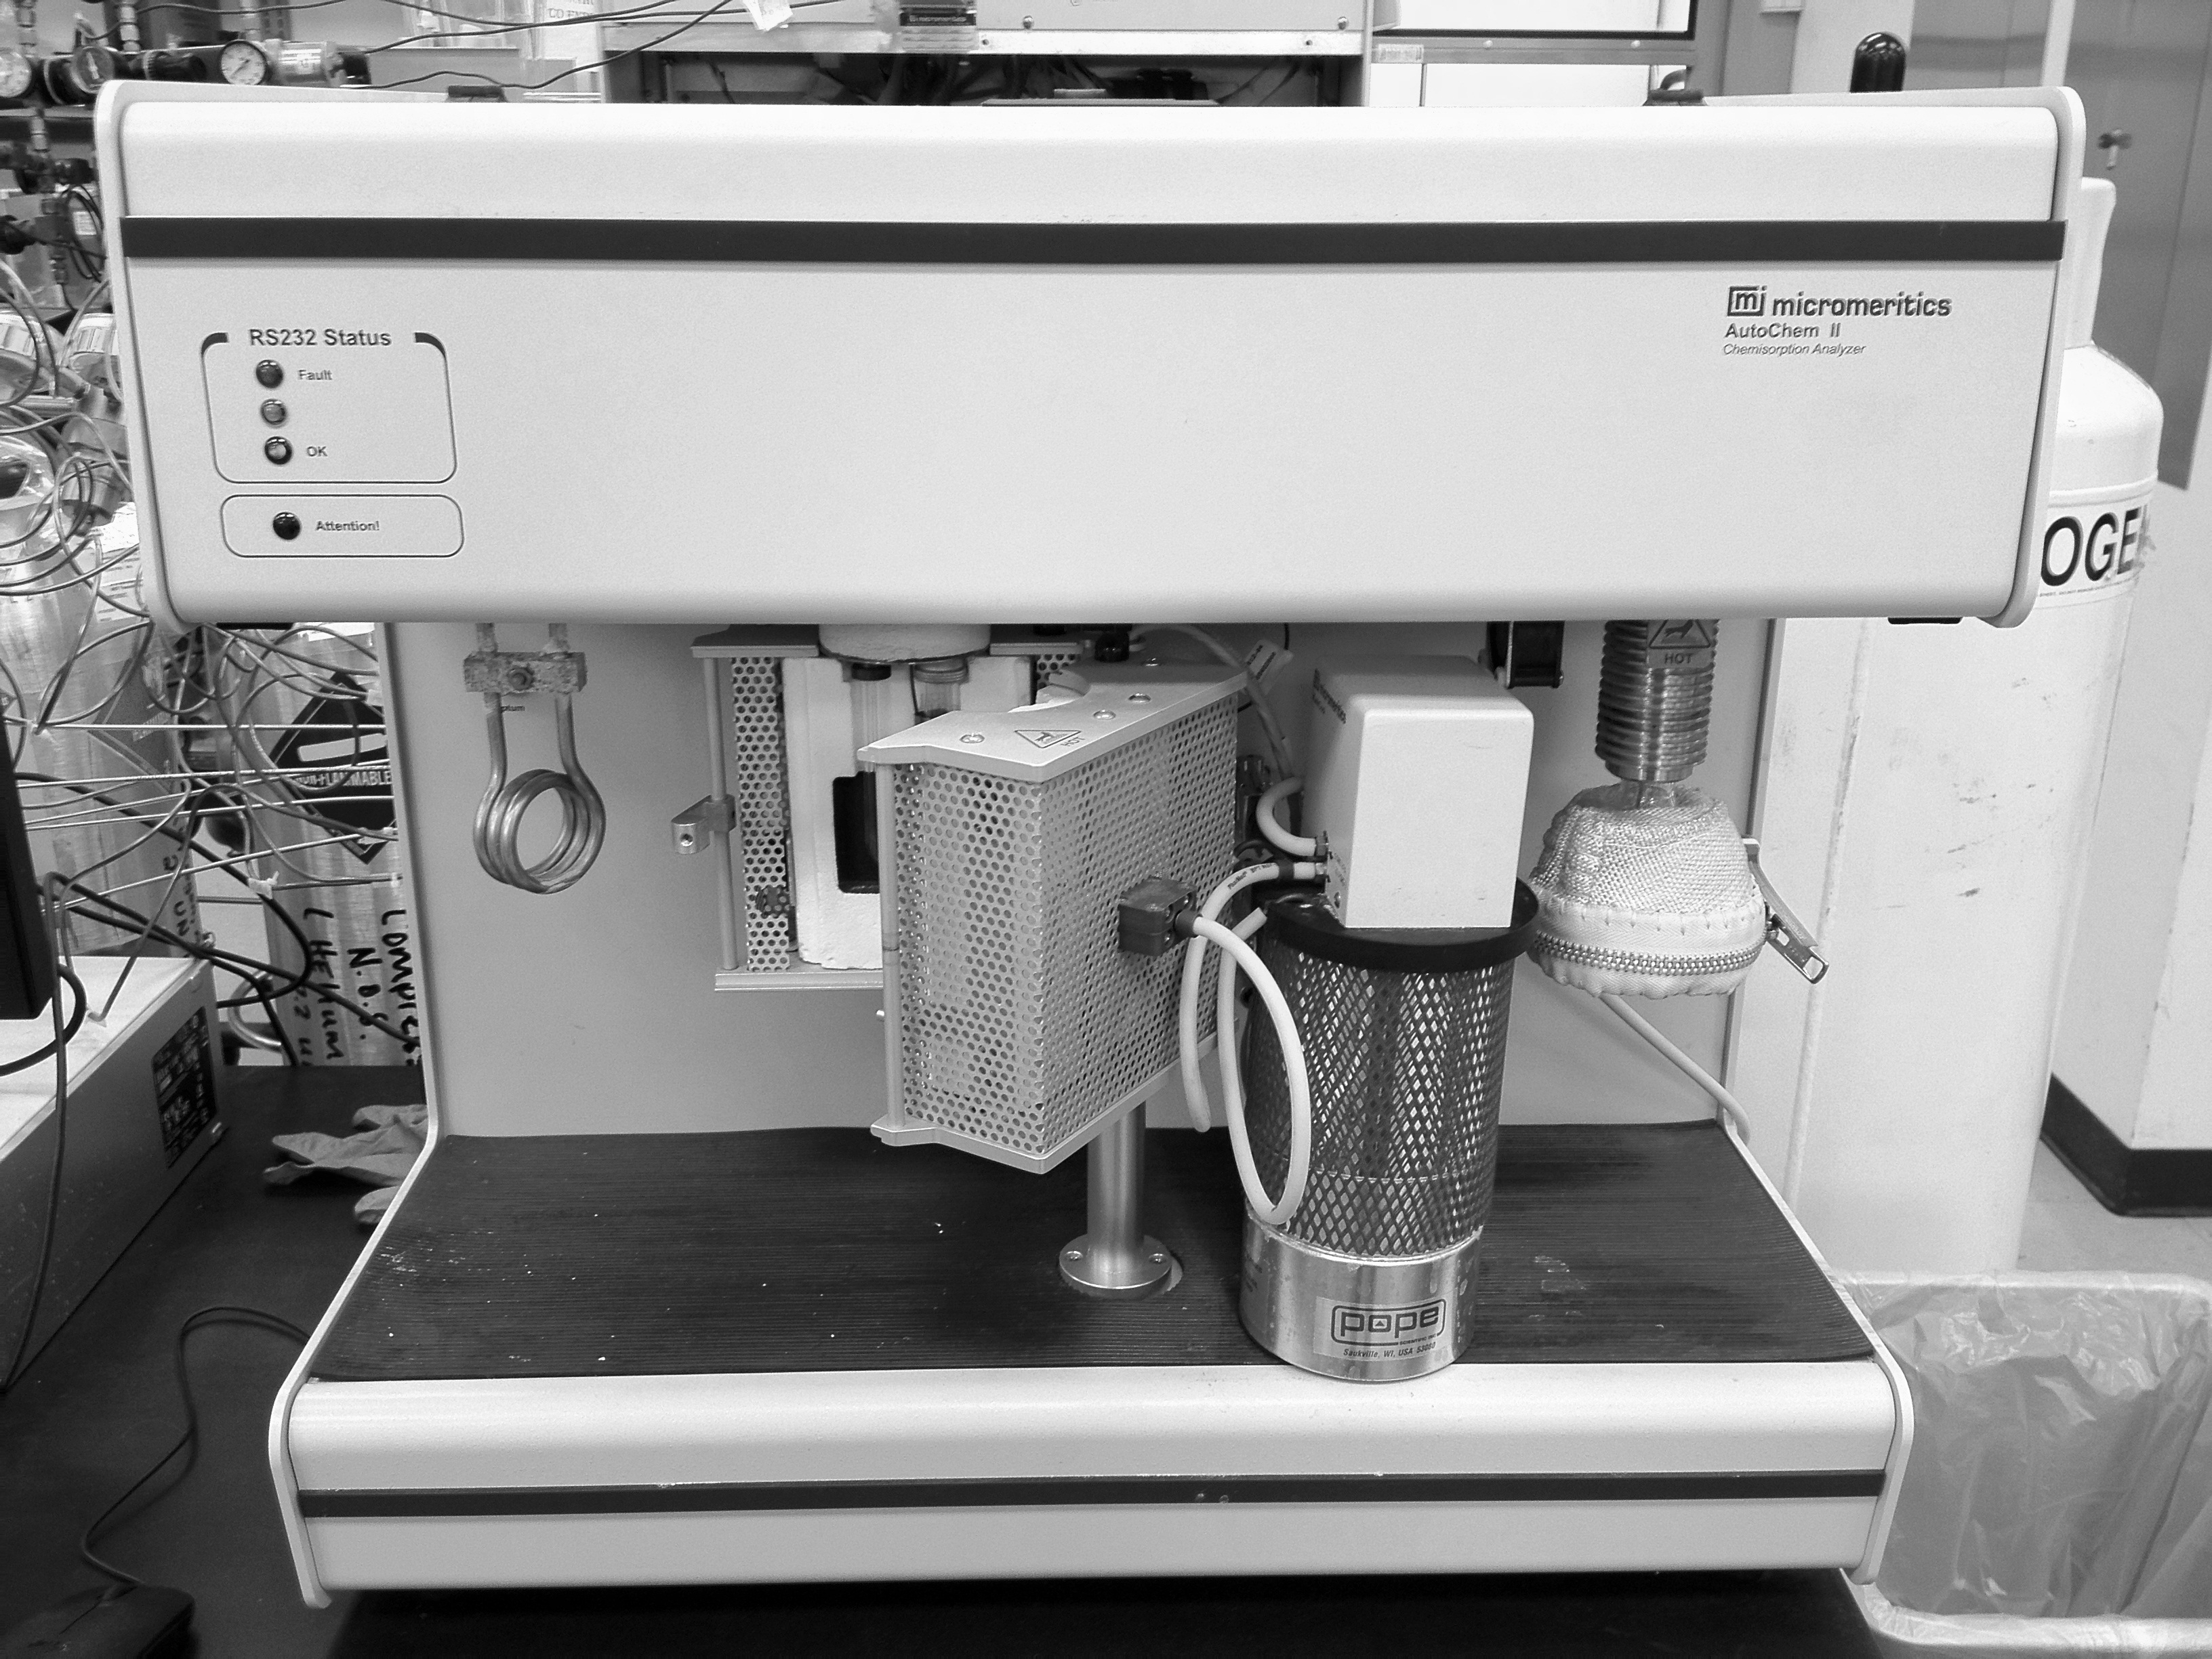
This detector is part of a typical commercial instrument such as a Micromeritics AutoChem 2920 (Figure \(\PageIndex{4}\)). This instrument is an automated analyzer with the ability to perform chemical adsorption and temperature-programmed reactions on a catalyst, catalyst support, or other materials.
Temperature Programmed Reduction (TPR)
TPR will determine the number of reducible species on a catalyst and will tell at what temperature each of these species was reduced. For example palladium is ordinarily found as Pd(0) or Pd(II), i.e., oxidation states 0 and +2. Pd(II) can be reduced at very low temperatures (5 - 10 °C) to Pd(0) following \ref{2}.
\[ PdO\ +\ H_{2} \rightarrow Pd(0)\ +\ H_{2}O \label{2} \]
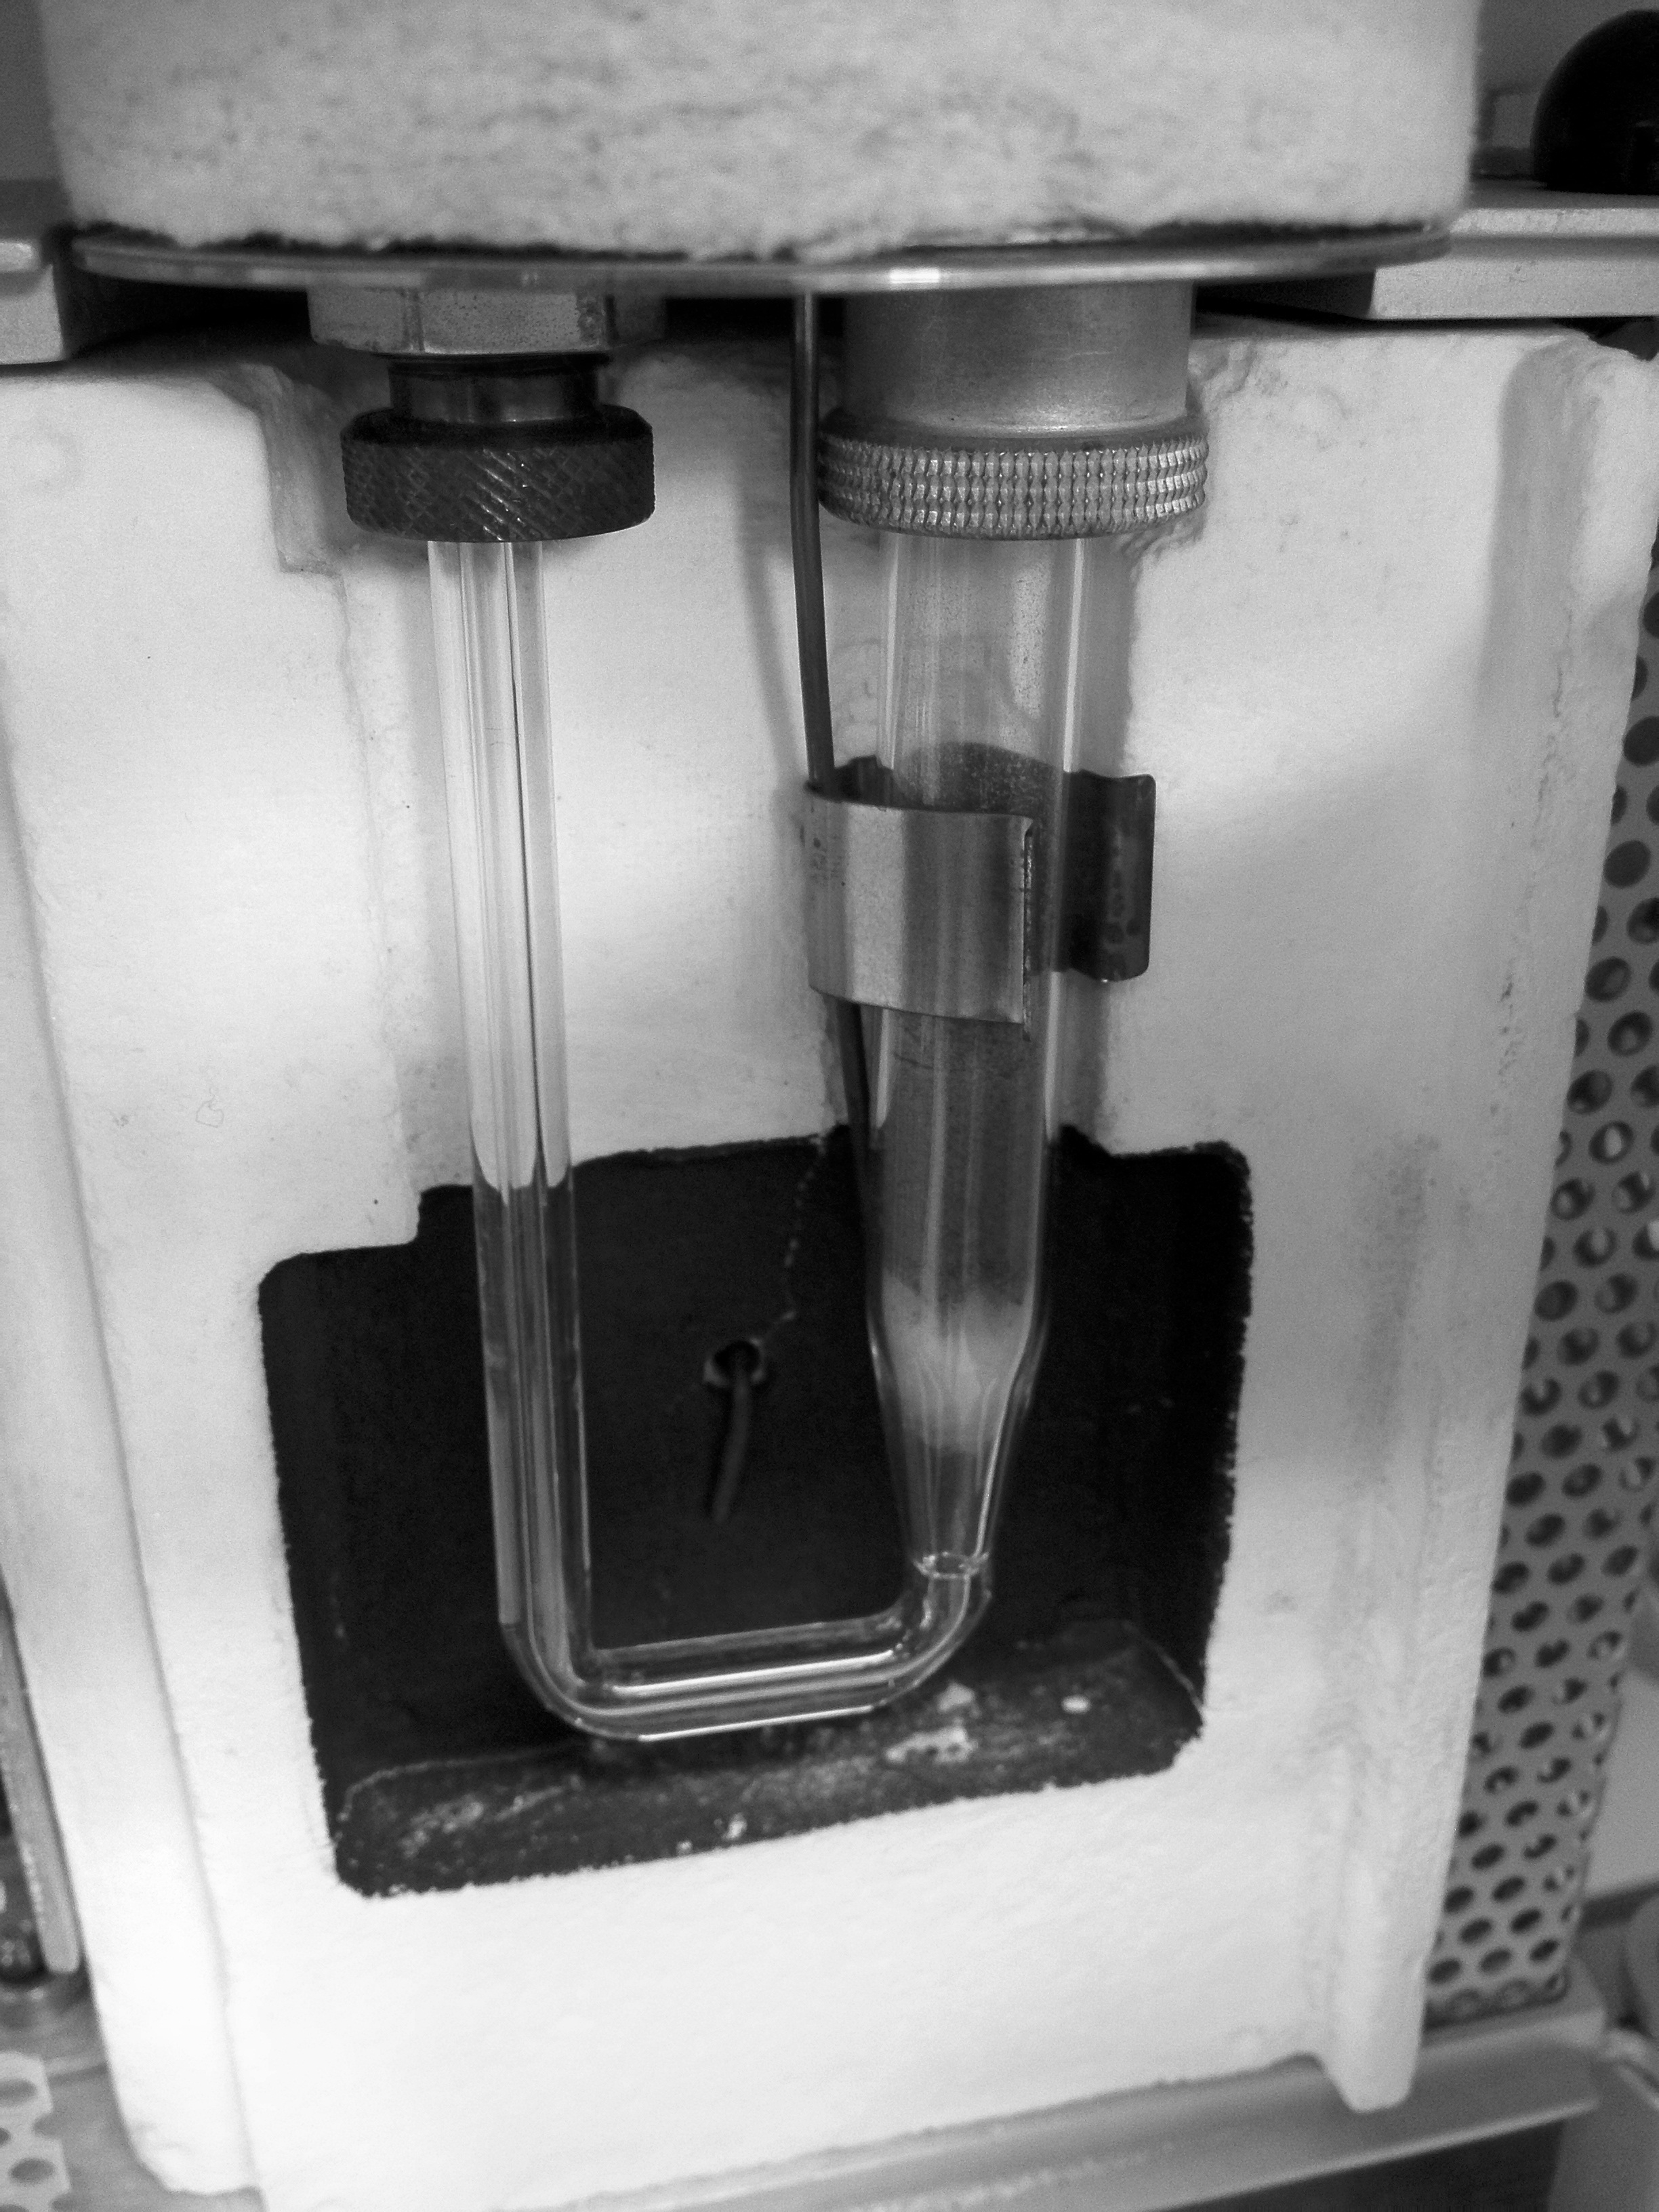
A 128.9 mg 1wt% Pd/Al2O3 samples is used for the experiment, Figure \(\PageIndex{5}\). Since we want to study the oxidation state of the commercial catalyst, no pre-treatment needs to be executed to the sample. A 10% hydrogen-argon mixture is used as analysis and reference gas. Argon has a low thermal conductivity and hydrogen has a much higher thermal conductivity. All gases will flow at 50 cm3/min. The TPR experiment will start at an initial temperature of 200 K, temperature ramp 10 K/min, and final temperature of 400 K. The H2/Ar mixture is flowed through the sample, and past the detector in the analysis port. While in the reference port the mixture doesn’t become in contact with the sample. When the analysis gas starts flowing over the sample, a baseline reading is established by the detector. The baseline is established at the initial temperature to ensure there is no reduction. While this gas is flowing, the temperature of the sample is increased linearly with time and the consumption of hydrogen is recorded. Hydrogen atoms react with oxygen atoms to form H2O.
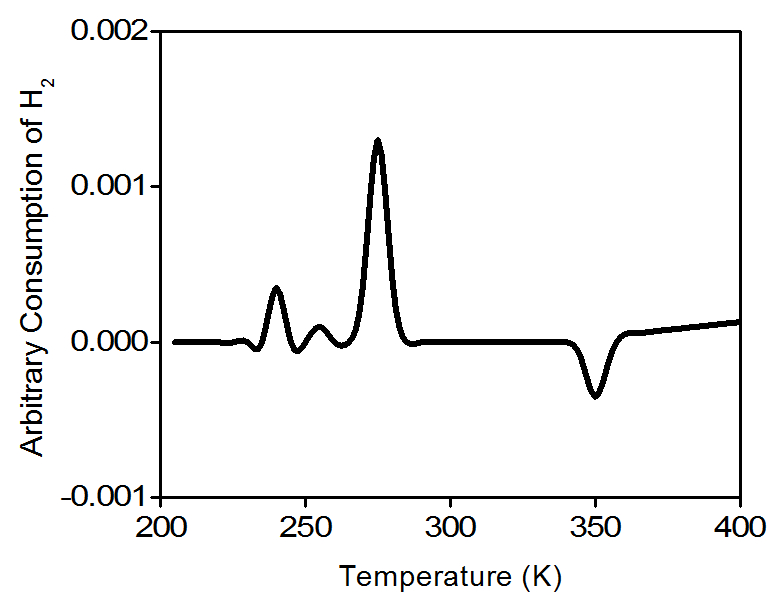
Water molecules are removed from the gas stream using a cold trap. As a result, the amount of hydrogen in the argon/hydrogen gas mixture decreases and the thermal conductivity of the mixture also decrease. The change is compared to the reference gas and yields to a hydrogen uptake volume. Figure \(\PageIndex{6}\) is a typical TPR profile for PdO.
Pulse Chemisorption
Once the catalyst (1 wt% Pd/Al2O3) has been completely reduced, the user will be able to determine how much palladium is active. A pulse chemisorption experiment will determine active surface area, percentage of metal dispersion and particle size. Pulses of hydrogen will be introduced to the sample tube in order to interact with the sample. In each pulse hydrogen will undergo a dissociative adsorption on to palladium active sites until all palladium atoms have reacted. After all active sites have reacted, the hydrogen pulses emerge unchanged from the sample tube. The amount of hydrogen chemisorbed is calculated as the total amount of hydrogen injected minus the total amount eluted from the system.
Data Collection for Hydrogen Pulse Chemisorption
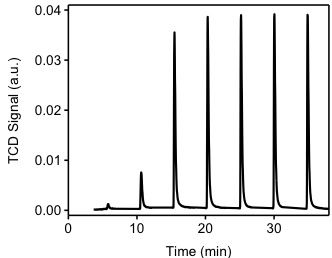
The sample from previous experiment (TPR) will be used for this experiment. Ultra high-purity argon will be used to purge the sample at a flow rate of 40 cm3/min. The sample will be heated to 200 °C in order to remove all chemisorbed hydrogen atoms from the Pd(0) surface. The sample is cooled down to 40 °C. Argon will be used as carrier gas at a flow of 40 cm3/min. Filaments temperature will be 175 °C and the detector temperature will be 110 °C. The injection loop has a volume of 0.03610 cm3 @ STP. As shown in Figure \(\PageIndex{6}\), hydrogen pulses will be injected in to the flow stream, carried by argon to become in contact and react with the sample. It should be noted that the first pulse of hydrogen was almost completely adsorbed by the sample. The second and third pulses show how the samples is been saturated. The positive value of the TCD detector is consistent with our assumptions. Since hydrogen has a higher thermal conductivity than argon, as it flows through the detector it will tend to cool down the filaments, the detector will then apply a positive voltage to the filaments in order to maintain a constant temperature.
Pulse Chemisorption Data Analysis
Table \(\PageIndex{1}\) shows me the integration of the peaks from Figure \(\PageIndex{7}\). This integration is performed by an automated software provided with the instrument. It should be noted that the first pulse was completely consumed by the sample, the pulse was injected between time 0 and 5 minutes. From Figure \(\PageIndex{7}\) we observe that during the first four pulses, hydrogen is consumed by the sample. After the fourth pulse, it appears the sample is not consuming hydrogen. The experiment continues for a total of seven pulses, at this point the software determines that no consumption is occurring and stops the experiment. Pulse eight is denominated the "saturation peak", meaning the pulse at which no hydrogen was consumed.
| Pulse n | Area |
| 1 | 0 |
| 2 | 0.000471772 |
| 3 | 0.00247767 |
| 4 | 0.009846683 |
| 5 | 0.010348201 |
| 6 | 0.10030243 |
| 7 | 0.009967717 |
| 8 | 0.010580979 |
Using \ref{3} the change in area (Δarean) is calculated for each peak pulse area (arean)and compared to that of the saturation pulse area (areasaturation = 0.010580979). Each of these changes in area is proportional to an amount of hydrogen consumed by the sample in each pulse. Table \(\PageIndex{2}\) shows the calculated change in area.
\[ \Delta Area_{n}\ =\ Area_{saturation}\ -\ Area_{n} \label{3} \]
| Pulse n | Arean | ΔArean |
| 1 | 0 | 0.010580979 |
| 2 | 0.000471772 | 0.0105338018 |
| 3 | 0.00247767 | 0.008103309 |
| 4 | 0.009846683 | 0.000734296 |
| 5 | 0.010348201 | 0.000232778 |
| 6 | 0.010030243 | 0.000550736 |
| 7 | 0.009967717 | 0.000613262 |
| 8 | 0.010580979 | 0 |
The Δarean values are then converted into hydrogen gas consumption using \ref{4}, where Fc is the area-to-volume conversion factor for hydrogen and SW is the weight of the sample. Fc is equal to 2.6465 cm3/peak area. Table \(\PageIndex{3}\) shows the results of the volume adsorbed and the cumulative volume adsorbed. Using the data on Table \(\PageIndex{3}\), a series of calculations can now be performed in order to have a better understanding of our catalyst properties.
\[ V_{adsorbed}\ =\ \frac{\Delta Area_{n} \times F_{c}}{SW} \label{4} \]
| Pulse n | arean | Δarean | Vadsorbed (cm3/g STP) | Cumulative quantity (cm3/g STP) |
| 1 | 0 | 0.0105809790 | 0.2800256 | 0.2800256 |
| 2 | 0.000471772 | 0.0105338018 | 0.2787771 | 0.558027 |
| 3 | 0.00247767 | 0.0081033090 | 0.2144541 | 0.7732567 |
| 4 | 0.009846683 | 0.0007342960 | 0.0194331 | 0.7926899 |
| 5 | 0.010348201 | 0.0002327780 | 0.0061605 | 0.7988504 |
| 6 | 0.010030243 | 0.0005507360 | 0.0145752 | 0.8134256 |
| 7 | 0.009967717 | 0.000613262 | 0.0162300 | 0.8296556 |
| 8 | 0.010580979 | 0 | 0.0000000 | 0.8296556 |
Gram Molecular Weight
Gram molecular weight is the weighted average of the number of moles of each active metal in the catalyst. Since this is a monometallic catalyst, the gram molecular weight is equal to the molecular weight of palladium (106.42 [g/mol]). The GMCCalc is calculated using \ref{5}, where F is the fraction of sample weight for metal N and WatomicN is the gram molecular weight of metal N (g/g-mole). \ref{6} shows the calculation for this experiment.
\[ GMW_{Calc}\ =\ \frac{1}{(\frac{F_{1}}{W_{atomic\ 1}})\ +\ (\frac{F_{2}}{W_{atomic\ 2}})\ +\ ...\ +\ (\frac{F_{N}}{W_{atomic\ N}})} \label{5} \]
\[ GMW_{Calc}\ =\ \frac{1}{(\frac{F_{1}}{W_{atomic\ Pd}})}\ =\ \frac{W_{atomic\ PD}}{F_{1}}\ =\ \frac{106.42 \frac{g}{g-mole}}{1}\ =\ 106.42 \frac{g}{g-mole} \label{6} \]
Metal Dispersion
The metal dispersion is calculated using \ref{7}, where PD is the percent metal dispersion, Vs is the volume adsorbed (cm3 at STP), SFCalc is the calculated stoichiometry factor (equal to 2 for a palladium-hydrogen system), SW is the sample weight and GMWCalc is the calculated gram molecular weight of the sample [g/g-mole]. Therefore, in \ref{8} we obtain a metal dispersion of 6.03%.
\[ PD\ =\ 100\ \times \ (\frac{V_{s} \times SF_{Calc}}{SW \times 22414}) \times GMW_{Calc} \label{7} \]
\[ PD\ =\ 100\ \times \ (\frac{0.8296556 [cm^{3}]\ \times \ 2}{0.1289 [g]\ \times 22414 [\frac{cm^{3}}{mol}]})\ \times \ 106.42 [\frac{g}{g-mol}]\ =\ 6.03\% \label{8} \]
Metallic Surface Area per Gram of Metal
The metallic surface area per gram of metal is calculated using \ref{9}, where SAMetallic is the metallic surface area (m2/g of metal), SWMetal is the active metal weight, SFCalc is the calculated stoichiometric factor and SAPd is the cross sectional area of one palladium atom (nm2). Thus, in \ref{10} we obtain a metallic surface area of 2420.99 m2/g-metal.
\[ SA_{Metallic}\ =\ (\frac{V_{S}}{SW_{Metal}\ \times \ 22414})\ \times \ (SF_{Calc})\ \times \ (6.022\ \times \ 10^{23})\ \times \ SA_{Pd} \label{9} \]
\[ SA_{Metallic}\ =\ (\frac{0.8296556\ [cm^{3}]}{0.001289\ [g_{metal}]\ \times \ 22414\ [\frac{cm^{3}}{mol}]})\ \times \ (2)\ \times \ (6.022\ \times \ 10^{23}\ [\frac{atoms}{mol}])\ \times \ 0.07\ [\frac{nm^{2}}{atom}]\ =\ 2420.99\ [\frac{m^{2}}{g-metal}] \label{10} \]
Active Particle Size
The active particle size is estimated using \ref{11}, where DCalc is palladium metal density (g/cm3), SWMetal is the active metal weight, GMWCalc is the calculated gram molecular weight (g/g-mole), and SAPd is the cross sectional area of one palladium atom (nm2). As seen in \ref{12} we obtain an optical particle size of 2.88 nm.
\[ APS\ =\ \frac{6}{D_{Calc}\ \times \ (\frac{W_{S}}{GMW_{Calc}})\ \times \ (6.022\ \times \ 10^23)\ \times \ SA_{Metallic}} \label{11} \]
\[ APS\ =\ \frac{600}{(1.202\ \times \ 10^{-20} [\frac{g_{Pd}}{nm^{3}}])\ \times \ (\frac{0.001289\ [g]}{106.42\ [\frac{g_{Pd}}{mol}]})\ \times \ (6.022\ \times \ 10^{23}\ [\frac{atoms}{mol}])\ \times \ (2420.99\ [\frac{m^{2}}{g-Pd}])} \ =\ 2.88\ nm \label{12} \]
In a commercial instrument, a summary report will be provided which summarizes the properties of our catalytic material. All the equations used during this example were extracted from the AutoChem 2920-User's Manual.
| Properties | Value |
| Palladium atomic weight | 106.4 g/mol |
| Atomic cross sectional area | 0.0787 nm2 |
| Metal Density | 12.02 g/cm3 |
| Palladium loading | 1 wt % |
| Metal dispersion | 6.03 % |
| Metallic surface area | 2420.99 m2/g-metal |
| Active particle diameter (hemisphere) | 2.88 nm |